Lola Gayle, STEAM Register Keeping track of Alaska's brown bears typically requires visual observations and getting your hands dirty with bear poo, but researchers say they have an easier, albeit equally messy, tool. Their idea is to gather DNA from residual bear drool that can be found on the carcasses of the tens of thousands of…
One of the most fundamental questions in modern astrophysics is how galaxies first formed. The Milky Way, the galaxy we live in, is an amalgamation of about 100 billion stars, gas, dust and enigmatic dark matter – all held together by gravity. The Milky Way itself is but one of many hundreds of billions of galaxies in the observable universe, with a wide range of sizes, masses, shapes and colours.
We are just beginning to understand how such different kinds of galaxies could arise and evolve. But the picture is blurry. For example, cosmological models of galaxy formation haven’t been able to establish exactly where the stars we see today were first born. Figuring out how galaxies came to be is hugely important. Without them, there would be no stars – and therefore no life in the universe.
Astronomers know that some of the Milky Way’s stars were born in the galaxy itself, whereas others were formed in smaller galaxies that the Milky Way eventually engulfed. But it is unclear which process is most common.
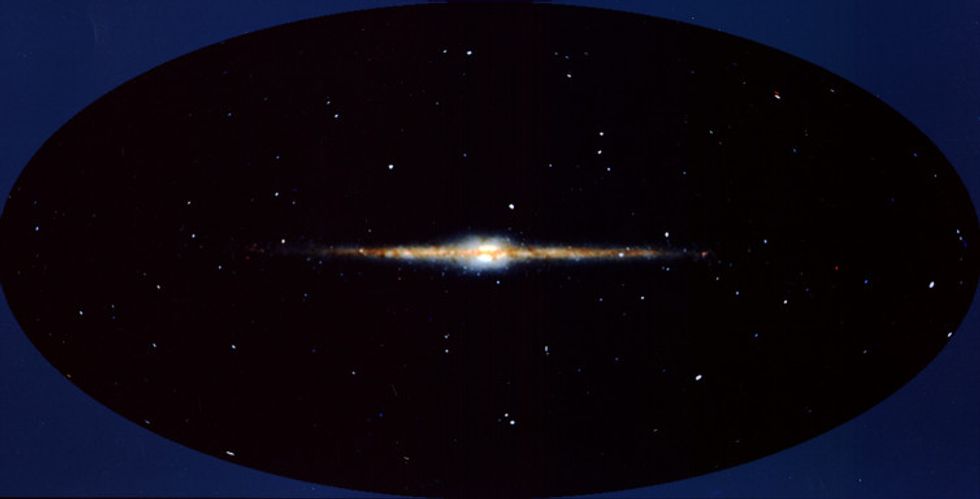
Infant stars are born in large groups – never in isolation. Some of these groups, called clusters, are still around today. They roughly come in two types: young, low-mass clusters that live in the Milky Way disk, and massive, old “globular clusters” which are located in the “stellar halo” of the Milky Way (a very large, thin, diaphanous structure) which envelops the disk of the Milky Way. Globular clusters contain a tiny fraction of all Milky Way stars, but astronomers suspect that they hold important clues to the early stages of how the galaxy formed.
Image of the disk and halo of the Milky Way by COBE in infrared. NASA
But we don’t really know how globular clusters formed either. Current models propose that most globular clusters formed in giant molecular clouds within turbulent disks in the early universe. They suggest that globular clusters host multiple generations of stars – stars born from material of other stars, some of which are now dead. However, these models cannot reproduce in detail what we actually observe in globular clusters.
What we know is that the universe only assembled the conditions to form lots of globular clusters in its youth. Ironically, these turbulent disks were also hostile to globular clusters – it is thought that most of them were wiped out by collisions with giant molecular clouds shortly after being born. Those that survived (there are about 150 in the Milky Way) may have lost a substantial fraction of their stars, perhaps even most of them. But if that’s the case, then there should be plenty of stars originally formed in globular clusters now residing in other parts of the galaxy.
The answer could be written in the stars themselves. Their locations, velocities and chemical compositions may hold clues to whether these stars were formed in the Milky Way or elsewhere. All the chemical elements in the universe, except for hydrogen, helium, and tiny amounts of lithium, were synthesised entirely in the interior of stars. When stars die, they shed their nucleosynthetic byproducts into the interstellar medium, out of which new stars are born. Thus, a stars’s chemical composition bears the signature of the evolution of its predecessors. So if we can work that out, it may be possible to establish a star’s origin.
The galaxy has many many stars, though, so to obtain meaningful answers, one needs very large samples. Thanks to recent technological developments, huge surveys currently collect data for hundreds of thousands to millions of Milky Way stars. One of them is the Apache Point Observatory Galactic Evolution Experiment (APOGEE). It stands out from the crowd because of its focus on infrared spectroscopy – a lower frequency of light than that we can see – as opposed to all other surveys that concentrate in the visible part of the spectrum.
This is important because of all the dust in the disk of the Milky Way. Dust is a lot less opaque in the infrared, so APOGEE can see through the dust into the inner regions of the Milky Way much better than optical surveys. This enabled us to estimate the abundances of some key elements for thousands of stars for the first time. We were also able to detect trace stellar families that would otherwise pass unnoticed amid a crowd of ordinary stars.
Peculiar stars
In this way, we discovered a population of stars with unusual chemical compositions, very enriched in nitrogen. This is interesting because it is typical of globular cluster stars. The properties of these new stars differ from those of existing globular clusters, suggesting that they were associated with clusters that no longer exist. The logical implication is that there once existed a very large population of globular clusters in the early Milky Way, which was almost entirely destroyed. Moreover, the properties of the new stars suggest that they are associated with the halo of the Milky Way, not its disk. That being the case, destroyed globular clusters may be the stuff that at least a quarter of the halo is made of.
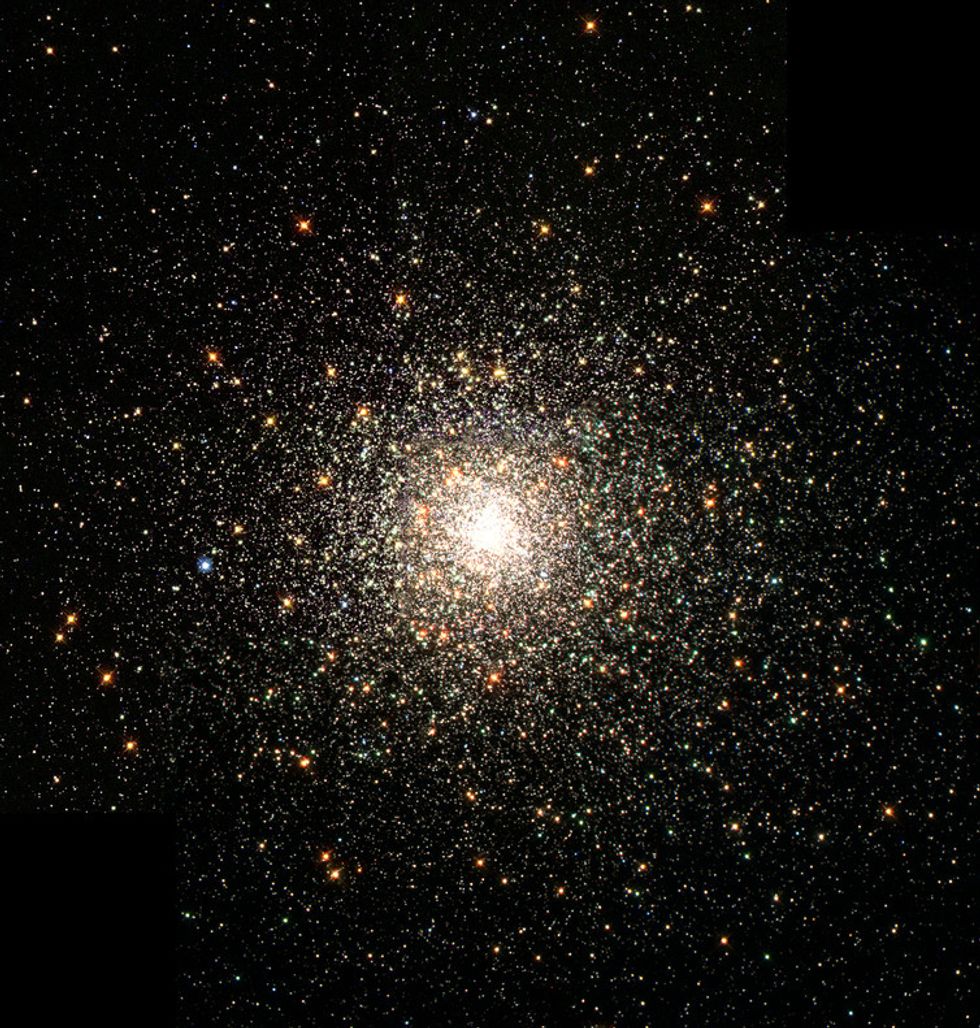
The Messier 80 globular cluster in the constellation Scorpius. NASA
If confirmed, this result will challenge models of galaxy formation. For instance, APOGEE’s result can constrain which fraction of the halo was formed in the galaxy. It also forces us to revise models of globular cluster formation, which have a hard time explaining the amount of nitrogen that we observe in these stars.
But perhaps a more far-reaching implication is that we might discover that globular clusters are in fact one of the the most typical star-forming units in the universe. In the past two decades, research has made it possible to estimate the mean chemical composition of stars in the cores of distant, unresolved elliptical galaxies, which are thought to be formed in similar ways to the Milky Way halo. Interestingly, this has shown that stars in those galaxies tend to be enriched in nitrogen and sodium, which is precisely what is found in globular clusters.
Indeed, globular clusters may have contributed substantially to the stellar budget of all galaxies in the universe – something we didn’t know before. This is a riveting prospect which could even come to change our understanding of how galaxies came about, including our own Milky Way.
Scientists in Britain have developed a type of HIV test using a USB stick that can give a fast and highly accurate reading of how much virus is in a patient's blood.
The device, created by scientists at Imperial College London and the privately-held U.S. firm DNA Electronics, uses a drop of blood to detect HIV, then creates an electrical signal that can be read by a computer, laptop or handheld device.
The researchers say the technology, although still in the early stages, could allow patients to regularly monitor their virus levels in a similar way to diabetes patients checking their blood sugar levels.
It could be particularly useful in remote settings to help HIV patients manage their treatment more effectively, since current tests to detect virus levels take at least three days and involve sending a blood sample to a laboratory.
"Monitoring viral load is crucial to the success of HIV treatment. At the moment, testing often requires costly and complex equipment that can take a couple of days to produce a result," said Graham Cooke, who co-led the research from the Imperial's department of medicine.
"We have taken the job done by this equipment, which is the size of a large photocopier, and shrunk it down to a USB chip."
The test, which uses a mobile phone chip, requires a drop of blood to be placed onto a spot on the USB stick. Any HIV in the sample triggers an acidity change, which the chip transforms into an electrical signal. This is sent to the USB stick, which shows the result on a computer or electronic device.
Published in the journal Scientific Reports, results showed the stick test was 95 percent accurate over 991 blood samples, and the average time to produce a reading was 20.8 minutes.
Some 36 million people worldwide are infected with the human deficiency virus (HIV) that causes AIDS, and the majority of them live in sub-Saharan Africa.
Current AIDS drugs, called anti-retrovirals, reduce virus levels in a patients blood to near zero.
But in some cases the drugs stop working - sometimes because virus has developed resistance to them - and the first sign of that would be a rise in a patient's so-called "viral load".
Virus levels can't be detected by routine HIV tests, which can only show whether or not a person has the virus.
“Sea-level rise” is a loaded statement and instils concern, scepticism and humour. From a sceptical stand point one could think about your own experience. I have been going to the beach near my parents’ house on the south coast of England for nearly 30 years. In all that time I can’t ever remember paddling in the water and thinking, “gosh, this is higher than it was last year”. Yet, over a similar period of time satellite observations show a global average sea-level rise of around 8cm. In fact a trend has been shown to go back further, to the late 19th and early 20th century.
The record of observations over the past 100 years or so begs the question, will this rise continue? A new study that colleagues and I have published in PNAS looks at what happens to the sea level at 2°C warming and beyond. Our work, led by Svetlana Jevrejeva of the UK’s National Oceanography Centre, shows two key things.
Selected estimates for sea level rises under 5°C warming. (Jevrejeva et al)
First, that for an emissions scenario that causes global temperature to rise by 2°C and 5°C relative to the global temperature around 1870, there are a range of sea levels projected from 53cm to 178cm above the level in 2000. Second, that while the global average is projected to increase with rising temperatures, sea levels will not increase by the same amount everywhere.
The sea isn’t actually ‘level’
Let’s start with the second point as it will help answer the first. The sea is not level. In fact, it is anything but level. The reason is gravity. The force that keeps your feet firmly on the ground is also acting upon the ocean. The ocean is continually adjusting itself so that its surface – the sea level – feels the same gravitational pull everywhere (called an equipotential surface).
Large things sitting on land, such as ice sheets, are big enough to pull (via their own gravity) the ocean towards them. If bits of an ice sheet or glacier fall off then their ability to pull the ocean towards them is less, so the ocean adjusts, and you have just added water to the ocean that wasn’t in it before which alters the sea level as well.
This adjustment is happening all the time. Around 20,000 years ago there used to be some enormous ice sheets over North America and Scandinavia, which pushed down the land surface in those places. As the ice sheets melted the land surface rebounded and is still doing so today. Further from where these ice sheets used to be, the land subsided and its still doing so today. And there was the small matter of all that melted ice raising global sea level by about 120m, which was adjusting itself to keep gravity equal across its surface.
Each of the components that contribute to sea level (glaciers, ocean warming, ice sheets and so on) has a unique pattern for how much it will add to sea level in a particular place. If we add them up we get the total sea level at that point and also how much each component has contributed.
Some future sea levels are more likely than others
This leads us back to the first point, where I said that for each temperature rise there are a range of possible projected sea levels. Scientists have run computer simulations of how different levels of greenhouse gases and aerosols could affect the climate (atmosphere and ocean), the size and shape of glaciers and ice sheets, the amount of water on land that humans can dam and extract, and the way the land and ocean respond to adding and removing ice and water.
The (really really) short result of all this research is that each component shows a range of possible responses to each scenario. By running the computer simulations many times, it appears that certain responses are more likely to happen than others. This allows us to say something about how likely a certain sea-level rise could occur in the future.
This is best shown with an example. Let’s take Jakarta. The Indonesian capital is home to around 12m people, of whom nearly 1.6m live less than 450cm above sea-level.
Our most likely projection for a temperature rise of 5°C is 85cm, which is pretty much the same as the global average. However, we can also think about what all those possible responses of each component are for a 5°C warming. In these situations there is a less than 5% chance of sea level being less than 49cm and less than 5% chance of sea level being more than 180cm.
In the two cases, different components contribute a different amount (remember they each have a unique pattern). In the “lower” projection (49cm) it is ocean warming that dominates, while in the “higher” projection (180cm) it is the Antarctic ice sheet that dominates, followed by not insignificant contributions from ocean warming, glaciers and the Greenland ice sheet.
Of course there are other things going on locally other than these components. For Jakarta, the gravest concern is subsidence. This mega city is sinking, mainly because of groundwater extraction. Projections of subsidence by 2100 for Jakarta are 230-300cm. Put these together with our higher sea level projection and we get 410-480cm of local sea-level rise. Remember the 1.6m people currently who live below 450cm? That number is likely to rise with a growing population.
We started with the phrase “sea-level rise”. It is really important that we unpack this sort of phrase to fully understand what it means. We must recognise the difference between a global number and a local number. For Jakarta, global sea-level is important, but the local sea-level matters too. The sea level is not level – we should accept this fact and embrace the complexity of what makes up rising seas.
An earthquake with a preliminary magnitude of 5.0 struck near Cushing, Oklahoma, on Sunday, the U.S. Geological Survey said.
The quake was centered 2 miles (3.2 km) west of Cushing, a small city of about 8,000 people about 50 miles west of Tulsa.
There were no immediate reports of damage or injuries, but several people in Tulsa say on Twitter that they felt the shaking.
The quake was among the larger temblors felt recently in Oklahoma, part of a flurry of seismic activity linked to energy production that has fueled growing concern.
Two smaller earthquakes, one at a 3.1 magnitude and the other at a 3.6 magnitude, rattled the area around Perry, Oklahoma, earlier on Sunday.
About two months ago, a magnitude 5.6 quake, one of the strongest ever recorded in Oklahoma, shook the area.
Most earthquakes occur naturally, but scientists have long linked some smaller tremors to oil and gas work underground, which can alter pressure points and cause shifts in the earth.
Cushing, where Sunday's quake occurred, is the location of intersecting oil pipelines, and is considered a hub for crude oil shipment.
(Reporting by Peter Cooney in Washington and Sharon Bernstein in Sacramento, Calif.; Editing by Chris Reese)
Lola Gayle, STEAM Register Twitter has been invaded by an army of software robots - most commonly referred to as "bots." Two new studies delve into this topic and how bots' bad behavior could ultimately sway public opinion and political discourse. Some bots have an important purpose, say for disseminating news and ideas to certain groups…
Lola Gayle, STEAM Register On June 22, 2015, a burst of galactic cosmic rays was recorded by the GRAPES-3 muon telescope located at TIFR's Cosmic Ray Laboratory in Ooty. That burst of rays occurred when the sun let loose a giant cloud of plasma that struck our planet at a speed of roughly 2.5 million kilometers…
Earlier this year, NASA's Magnetospheric Multiscale mission (MMS) achieved the closest flying separation of a multi-spacecraft formation with only four-and-a-half miles between the four satellites. Now, the team of four satellites is breaking records again, this time earning a Guinness World Record for the highest altitude fix of a GPS signal. When the satellites are closest…
Jay Thompson, Cassini Public Engagement, NASA/JPL Humans sometimes struggle to adjust to Daylight Saving Time, but just measuring the exact length of a Saturn day is one of the big challenges for scientists on NASA's Cassini mission. Over more than a decade in Saturn orbit, Cassini's instruments have wrestled with confusing measurements to determine the planet's…
Two prominent U.S. lawmakers on Thursday called on federal antitrust regulators to probe whether Sanofi SA, Eli Lilly and Co, Merck & Co Inc and Novo Nordisk A/S colluded to set prices for insulin and other diabetes drugs.
The request by U.S. Senator Bernie Sanders and Representative Elijah Cummings follows a similar letter they sent last fall calling for an investigation into 14 drug companies over price increases of generic drugs.
U.S. prosecutors could file the first charges by the end of the year in their subsequent criminal investigation of generic drugmakers over suspected price collusion, Bloomberg reported on Thursday.
A Justice Department spokesman declined to comment.
In their latest letter to the Justice Department and Federal Trade Commission, Sanders, an independent, and Cummings, a Democrat, raised questions about skyrocketing prices for insulin, and included a chart showing that many of the price spikes appeared to occur in tandem.
They noted that the original patent on insulin, a hormone used by diabetics to control blood sugar levels, expired 75 years ago.
Sanofi spokeswoman Ashleigh Koss said in an emailed statement that "Sanofi sets the prices of our treatments independently."
Novo Nordisk also said it sets prices "independently" and said it stands by its business practices. A spokeswoman for Merck said the company does not make insulin.
Merck makes other products to treat diabetes.
Officials at Lilly did not immediately respond to a request for comment.
Shares of several generic drugmakers fell on Thursday after the report of pending Justice Department charges. Mylan N.V. closed down 6.9 percent, Allergan Plc fell 4.5 percent and Endo International Plc dropped 19.5 percent. Teva Pharmaceuticals Inc Ltd , which recently acquired Allergan's generics business, fell 9.5 percent.
"We do not think the major generic companies have likely participated in significant pricing collusion," A/B Bernstein analyst Ronny Gal said in a research note.
Several generic drugmakers, including Mylan, Allergan, Endo and Taro Pharmaceutical Industries Ltd , had previously disclosed that they were subpoenaed in connection with the antitrust investigation by the Justice Department. Bloomberg said the probe spans more than a dozen companies and about two dozen drugs, citing people familiar with the matter.
Impax Laboratories Inc said earlier this year that the Justice Department had requested information on four drugs: blood pressure pill digoxin, asthma drug terbutaline sulfate, prilocaine/lidocaine cream and calcipotriene solution, which is used to treat psoriasis.
A spokesman from Teva said the company "is not aware of any facts that would give rise to an exposure to the company with respect to these subpoenas."
Officials at Endo and Lannett Company Inc did not immediately respond to requests for comment.
Aggressive drug pricing has come under intense scrutiny after Democratic presidential candidate Hillary Clinton tweeted her intent to tackle high prices last year.
An August report from the Government Accountability Office found that more than 300 of 1,441 generic drugs analyzed had at least one price increase of 100 percent or more between the first quarter of 2010 and the first quarter of 2015.
In February, Sanders and Cummings asked the U.S. Department of Health and Human Services' enforcement arm to investigate generic drug price increases.
Recent price hikes that have drawn fire included Turing Pharmaceuticals' decision in 2015 to raise by 5,000 percent the price of a decades-old treatment for a dangerous parasitic infection.
Generic drugmakers, possibly reacting to the political headwinds, reined in price hikes this year.
Guggenheim Securities, citing polling of generic drugmakers, last month estimated that overall U.S. generic drug prices would dip by a percentage in the mid-single digits this year.
The price erosion has been felt by drug wholesalers like McKesson Corp and Amerisource Bergen Corp , which rely on price fluctuations for part of their profit margins.
(Reporting by Deena Beasley in Los Angeles; Additional reporting by Sarah N. Lynch in Washington, D.C., Nikhil Subba and Sweta Singh in Bengaluru; Editing by Bernard Orr and Leslie Adler)
Today the sun is shining during my commute home from work. But this weekend, public service announcements will remind us to “fall back,” ending daylight saving time (DST) by setting our clocks an hour earlier on Sunday, Nov. 6. On Nov. 7, many of us will commute home in the dark.
This semiannual ritual shifts our rhythms and temporarily makes us groggy at times when we normally feel alert. Moreover, many Americans are confused about why we spring forward to DST in March and fall back in November, and whether it is worth the trouble.
The practice of resetting clocks is not designed for farmers, whose plows follow the sun regardless of what time clocks say it is. Yet many people continue to believe that farmers benefit, including lawmakers during recent debates over changing California DST laws. Massachusetts is also studying whether to abandon DST.
Changing our clocks does not create extra daylight. DST simply shifts when the sun rises and sets relative to our society’s regular schedule and routines. The key question, then, is how people respond to this enforced shift in natural lighting. Most people have to be at work at a certain time – say, 8:30 a.m. – and if that time comes an hour earlier, they simply get up an hour earlier. The effect on society is another question, and there, the research shows DST is more burden than boon.
No energy savings
Benjamin Franklin was one of the first thinkers to endorse the idea of making better use of daylight. Although he lived well before the invention of light bulbs, Franklin observed that people who slept past sunrise wasted more candles later in the evening. He also whimsically suggested the first policy fixes to encourage energy conservation: firing cannons at dawn as public alarm clocks and fining homeowners who put up window shutters.
To this day, our laws equate daylight saving with energy conservation. However, recent research suggests that DST actually increases energy use.
Poster celebrating enactment of daylight saving time during World War I, 1917 (click to zoom).
This is what I found in a study coauthored with Yale economist Matthew Kotchen. We used a policy change in Indiana to estimate DST effects on electricity consumption. Prior to 2007, most Indiana counties did not observe DST. By comparing households’ electricity demand before and after DST was adopted, month by month, we showed that DST had actually increased residential electricity demand in Indiana by 1 to 4 percent annually.
The largest effects occurred in the summer, when DST aligns our lives with the hottest part of the day, so people tend to use more air conditioning, and late fall, when we wake up in the dark and use more heating with no reduction in lighting needs.
Other studies corroborate these findings. Research in Australia and in the United States shows that DST does not decrease total energy use. However, it does smooth out peaks and valleys in energy demand throughout the day, as people at home use more electricity in the morning and less during the afternoon. Though people still use more electricity, shifting the timing reduces the average costs to deliver energy because not everyone demands it during typical peak usage periods.
Other outcomes are mixed
DST proponents also argue that changing times provides more hours for afternoon recreation and reduces crime rates. But time for recreation is a matter of preference. There is better evidence on crime rates: Fewer muggings and sexual assaults occur during DST months because fewer potential victims are out after dark.
So overall, the net benefits from these three durational effects of crime, recreation and energy use – that is, impacts that last for the duration of the time change – are murky.
Other consequences of DST are ephemeral. I think of them as bookend effects, since they occur at the beginning and end of DST.
Even when we gain that hour back in the fall, we must readjust our routines over several days because the sun and our alarm clocks feel out of synchronization. Some impacts are serious: During bookend weeks, children in higher latitudes go to school in the dark, which increases the risk of pedestrian casualties. Dark commutes are so problematic for pedestrians that New York City is spending US$1.5 million on a related safety campaign. And heart attacks increase after the spring time shift – it is thought because of lack of sleep – but decrease to a lesser extent after the fall shift. Collectively, these bookend effects represent net costs and strong arguments against retaining DST.
Pick your own time zone?
Spurred by many of these arguments, several states are considering unilaterally discontinuing DST. The California State Legislature considered a bill this term that would have asked voters to decide whether or not to remain on Pacific Standard Time year-round (the measure was passed by the State Assembly but rejected by the Senate).
On the East Coast, Massachusetts has commissioned research on the impacts of dropping DST and joining Canada’s Maritime provinces on Atlantic Time, which is one hour ahead of Eastern Standard Time. If this occurred, Massachusetts would be an hour ahead of all of its neighboring states during winter months, and travelers flying from Los Angeles to Boston would cross five time zones.
Countries observing daylight saving time (blue in Northern Hemisphere, orange in Southern Hemisphere). Light gray countries have abandoned DST; dark gray nations have never practiced it.
These proposals ignore a fundamental fact: Daylight saving time relies on coordination. If one state changes its clocks a week early, neighboring states will be out of sync.
Some states have good reason for diverging from the norm. Notably, Hawaii does not practice DST because it is much closer to the equator than the rest of the nation, so its daylight hours barely change throughout the year. Arizona is the sole contiguous state that abstains from DST, citing its extreme summer temperatures. Although this disparity causes confusion for western travelers, the state’s residents have not changed clocks’ times for over 40 years.
In my research on DST I have found that everyone has strong opinions about it. Many people welcome the shift to DST as a signal of spring. Others like the coordinated availability of daylight after work. Dissenters, including farmers, curse their loss of quiet morning hours.
When the evidence about costs and benefits is mixed but we need to make coordinated choices, how should we make DST decisions? When the California State Senate opted to stick with DST, one legislator stated, “I like daylight savings. I just like it.” But politicians’ whims are not a good basis for policy choices.
The strongest arguments support not only doing away with the switches but keeping the nation on daylight saving time year-round. Yet humans adapt. If we abandon the twice-yearly switch, we may eventually slide back into old routines and habits of sleeping in during daylight. Daylight saving time is the coordinated alarm to wake us up a bit earlier in the summer and get us out of work with more sunshine.
Diplomats from 196 nations gather from Monday for 12-day UN climate talks tasked with charting a path for capping global warming at "well below" two degree Celsius (3.6 Fahrenheit) above pre-industrial era levels.
Here are some key climate measures from 2015 and 2016 which suggest why that may be difficult:
- +2.8C (5.0F) -
Earth is on track for a third successive year of highest-ever average surface temperatures since records began in 1880.
Each of the first eight months of 2016 were the hottest ever registered (with September the second hottest). September was nearly 1C (1.8F) above the 20th century average for that month.
For the first time ever, the average temperature in 2015 was a full degree Celsius above the pre-industrial era benchmark used by the UN climate science panel and in UN talks.
In the Arctic, land surface temperature in 2015 matched the record years of 2007 and 2011, both of which were 2.8C higher than a century earlier, when records for the region began.
- 400 ppm -
The atmospheric concentrations of the three most potent greenhouse gases -- carbon dioxide (CO2), methane (CH4), and nitrous oxide (N2O) -- all hit new highs in 2015.
Methane levels, according to a new assessment, may be twice as high as previously thought.
For the first time, the concentration of CO2 -- by far the dominant greenhouse gas -- stayed above 400 parts per million (ppm) across 2015, as measured at the Mauna Loa Observatory on the island of Hawaii.
CO2 levels are going up by just over two parts per million -- about half a percent -- every year.
Most climate scientists agree that the CO2 concentrations must be capped at 450 ppm to have a fighting chance of preventing the global thermometer from rising by more than 2C above the pre-industrial benchmark.
- 4.4 million km2 -
High-altitude glaciers declined in surface area in 2015 for the 36th year in a row.
The Greenland ice sheet lost close to two trillion tonnes of ice mass between 2003 and 2013.
Arctic sea ice shrank this summer to 4.4 million square kilometres (1.7 million square miles) on September 16 -- the 2012 record was 3.39 million square kilometres (1.3 million square miles).
The Arctic Ocean could be ice free in summer as early as 2030.
- +3.3 mm per year -
Oceans continued to rise in 2015, reaching a level 70 millimetres (2.75 inches) above the 1993 water mark. That works out to about 3.3 mm (0.13 inches) per year, though there are spots in the Pacific and Indian Oceans where it is more than that.
The pace of sea level rise is likely to pick up in coming decades as ice sheets and glaciers shed mass, threatening the homes and livelihoods of tens of millions of people in low-lying areas around the world.
On current trends, greenhouse gas emissions could cause the Antarctic ice sheet to retreat sufficiently by 2100 to lift global oceans by a metre, double previous estimates.
- Extreme events -
Some scientists have calculated that the number of climate-related extreme events -- droughts, forest fires, floods, major storm surges -- have doubled since 1990.
Climate change boosted the intensity of typhoons battering China, Taiwan, Japan and the Korean Peninsula since 1980 by 12 to 15 percent, according to a recent study.
- 1,688 species affected -
Of the 8,688 species of animals and plants listed as "threatened" on the International Union for the Conservation of Nature's (IUCN) Red List, 19 percent -- 1,688 species -- have been negatively affected by climate change.
The Great Barrier Reef off the east coast of Australia saw it's worst-ever episode of coral bleaching earlier this year.
A rise in temperature of more than 1.5C (2.7F) will trigger a destabilisation of ecosystems in the Mediterranean basin not seen in 10,000 years, according to a recent study.
Lola Gayle, STEAM Register "Our Sun is a second- or third-generation star. All of the rocky and metallic material we stand on, the iron in our blood, the calcium in our teeth, the carbon in our genes were produced billions of years ago in the interior of a red giant star. We are made of star-stuff."…