Trump's tactics are nothing new — they've fueled rage and violence for centuries
Peter C. Mancall, USC Dornsife College of Letters, Arts and Sciences
Recently, President Donald Trump declared that he is “bringing Columbus Day back from the ashes.” He hopes to make up for the removal of commemorative statues important to “the Italians that love him so much.”
But Columbus Day had not been scrapped or reduced to ashes. Although President Joe Biden issued a proclamation for Indigenous Peoples Day in October 2024, on the same day he also declared a holiday in honor of Christopher Columbus.
Nonetheless, Trump posted in April 2025, “Christopher is going to make a major comeback.” By using Columbus’ name, which means “Christ-bearer,” a president who covets the praise of faith leaders yoked the explorer to his campaign promise: “For those who have been wronged and betrayed, I am your retribution.”
By reasserting the importance of Columbus, the president took a stand against the toppling and vandalism of statues of Columbus. In this case, his act of retribution for his supporters focused on the holiday, which he could declare more easily than returning icons of a fallen man to empty pedestals.
Trump’s statement invoked the politics of grievance – a sense of resentment or injustice fueled by perceived discrimination – that have characterized his actions for years.
The list of targets for his retribution, which have included Harvard University, elite law firms and former allies he believes have betrayed him, now exceeds 100, according to an NPR review.
As a historian of early America, I am familiar with how grievance marked the colonial era. Throughout this period, grievance fueled rage and violence.
European grievance in America
Europeans who arrived in the Americas following Columbus’ 1492 journey claimed the territories in the Western Hemisphere through an obsolete legal theory known as the “doctrine of discovery.”
Spanish, English, French, Dutch and Portuguese rulers, according to this notion, owned portions of the Americas, regardless of the claims of Indigenous peoples. This presumption of ownership justified, in their minds, the use of violence against those who resisted them.
In 1598, for example, Spanish soldiers patrolling the pueblo of Acoma in New Mexico demanded food from local residents, whom the colonizers saw as their subordinates. The town’s inhabitants, believing the request excessive, fought instead, killing 11 Spaniards.
In response, the governor of New Mexico, a territory almost entirely populated by Indigenous peoples, ordered the systematic amputations of the hands or feet of residents whom the soldiers thought had participated in the attack. They also enslaved hundreds in the town. Roughly 1,500 residents of Acoma died in the conflict, according to the National Park Service, a response seemingly driven more by grievance than strategy.
English colonizers proved just as quick to deploy extraordinary violence if they believed Native Americans deprived them of what they thought was theirs.
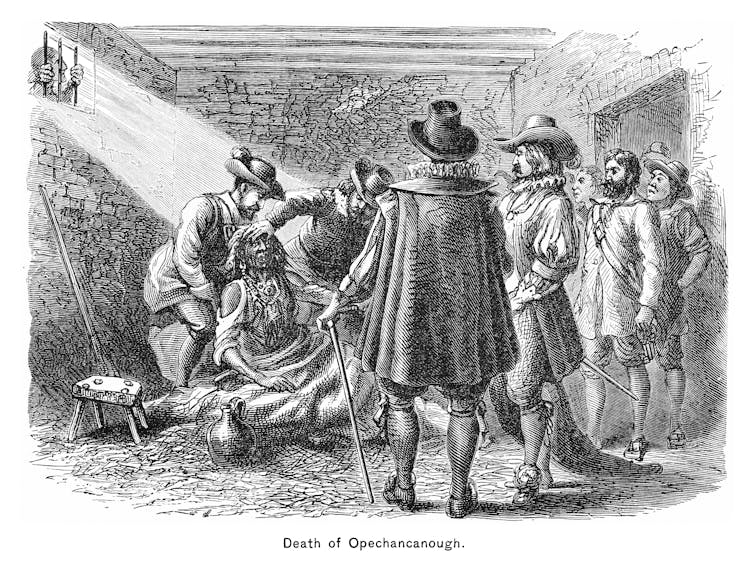
In March 1622, soldiers from the Powhatan Confederation – composed of Algonquian tribes from present-day Virginia – launched a surprise attack to protest encroachments on their lands, killing 347 colonists.
The English labeled the event a “barbarous massacre,” using language that dehumanized the Powhatans and cast them as villainous raiders. An English pamphleteer named Edward Waterhouse castigated these Indigenous people as “wyld naked Natives,” “Pagan Infidels” and “perfidious and inhumane.”
 Opechancanough was paramount chief of the Powhatan Confederacy in present-day Virginia from 1618 until his death in 1646.mikroman6/Getty Images
War began almost immediately. Colonial soldiers embraced a scorched-earth strategy, burning houses and crops when they could not locate their enemies. On May 22, 1623, one group sailed into Pamunkey territory to rescue captives.
Under a ruse of peaceful negotiation, they distributed poison to some 200 Native residents. By doing so, the colonial soldiers, driven by grievance more than law, ignored their own rules of war, which forbade the use of poison in war.
Grievance drove colonists against each other
Even among colonists, grievance promoted violence.
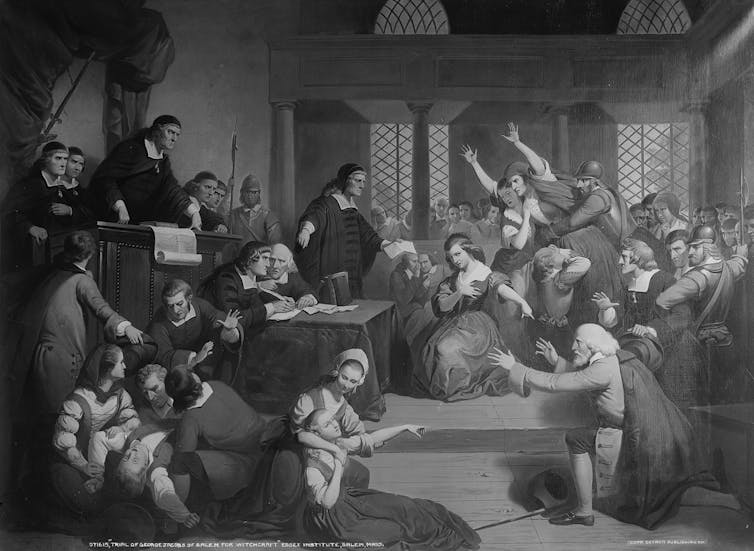
In 1692, residents of Salem, Massachusetts, believed their misfortunes were the work of the devil. Their anxieties and anger led them to accuse others of witchcraft.
As historians who have studied the Salem witch trials have argued, many of the accusers in agricultural Salem Village – modern-day Danvers – harbored resentments against neighbors who had closer ties to nearby Salem Town, which was more commercial.
The aggrieved found a spokesman in the Rev. Samuel Parris, whose own earlier failure in business had led him to look for a new path forward as a minister. Parris’ anger about his earlier disappointments fueled his indignation about what he saw as inadequate economic support from local authorities.
In a sermon, he underscored his financial irritation by emphasizing Judas’ betrayal of Jesus for “a poor & mean price,” as if it was the amount that mattered. The resentful residents and their bitter minister fueled the largest witch hunt in American history, which left at least 20 of the accused dead.
 The painting ‘Trial of George Jacobs of Salem for Witchcraft’ in 1692 by T.H. Matteson.Tompkins Harrison Matteson/Library of Congress via AP
The most obvious forerunner of today’s grievance-fueled politics was a rebellion in the spring and summer of 1676 by backcountry colonists in Virginia who battled their Jamestown-based colonial government. They were led by Nathaniel Bacon, a tobacco farmer who believed that provincial officials were not doing enough to protect outlying farms from attacks by Susquehannocks and other Indigenous residents.
Bacon and his followers, consumed by their “declaration of grievances,” petitioned the local government for help. When they did not get the result they wanted, they marched against Jamestown. They set the capital alight and chased Gov. William Berkeley away.
Bacon succumbed to dysentery in October, and the movement collapsed without its charismatic leader. Berkeley survived but lost his position.
The rebellion has become etched into history as a violent attack against governing authorities that foreshadowed the 2021 assault on the U.S. Capitol.
When President Trump invokes alleged insults to one community to satisfy the yearnings of his followers, he and his allies run the risk of once again stoking the passions of the aggrieved.
Acts of grievance come in different forms, depending on historical and political circumstance. But the urge to reclaim what someone thinks should be theirs can lead to deadly violence, as earlier Americans repeatedly discovered.![]()
Peter C. Mancall, Andrew W. Mellon Professor of the Humanities, USC Dornsife College of Letters, Arts and Sciences
This article is republished from The Conversation under a Creative Commons license. Read the original article.


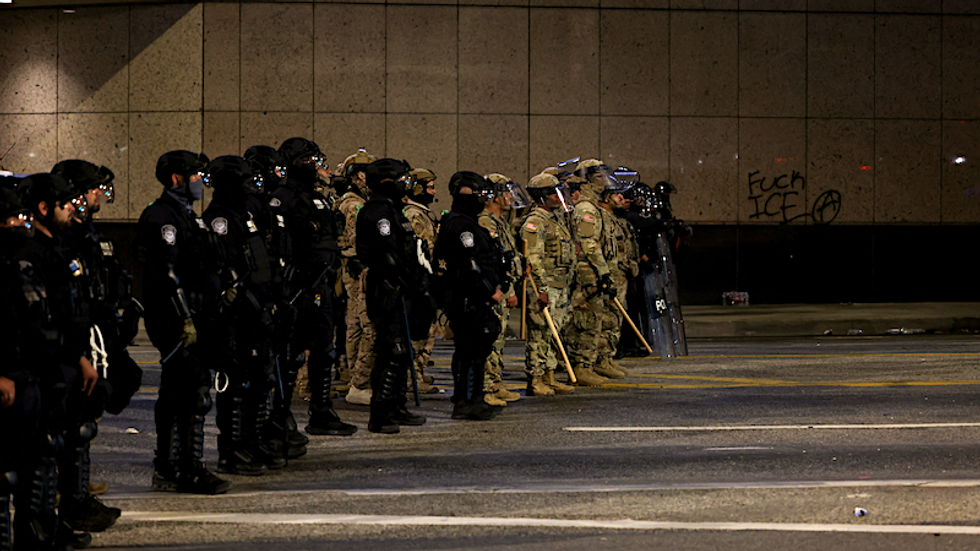
 Police officers stand guard during a protest in downtown Los Angeles. REUTERS/Aude Guerrucci