Scientists in Florida are on the cusp of developing promising methods to control toxic algae blooms like the “red tide” that has been killing marine life along a 150-mile (240-km) stretch of the Gulf Coast, the head of a leading marine lab said on Wednesday.
Michael Crosby, president and chief executive of the Mote Marine Laboratory in Sarasota, welcomed a red tide emergency order issued this week by Governor Rick Scott, designating more state money for research, cleanup and wildlife rescues.
Interest in mitigation technologies has been heightened by a 10-month-long toxic algae bloom off Florida’s southwestern coast that has caused mounds of rotting fish to wash up on beaches from Tampa to Naples.
The red tide also has been implicated in at least 266 sea turtle strandings and is suspected or determined to have caused 68 manatee deaths so far this year, according to Florida Fish and Wildlife Conservation Commission figures.
In hopes of combating future outbreaks, scientists are field testing a patented process that would pump red-algae-tainted seawater into an ozone-treatment system and then pump the purified water back into the affected canal, cove or inlet, Crosby said.
Experiments carried out in huge 25,000-gallon tanks succeeded in removing all traces of the algae and its toxins, with the water chemistry reverting to normal within 24 hours, he said.
Scientists also are studying the possible use of naturally produced compounds from seaweed, parasitic algae and filter-feeding organisms that could be introduced to fight red tides.
A “BAD BLOOM”
Red tides occur on an almost yearly basis off Florida, starting out in the Gulf of Mexico where swarms of microscopic algae cells called Karenia brevis feed on deep-sea nutrients and are sometimes carried by currents close to shore, usually in the fall.
This year’s Gulf Coast Florida bloom is the worst in more than a decade, originating last October and persisting well into the summer tourist season while spreading over 150 miles of coastline spanning seven counties.
“It’s a bad bloom by any standard,” said Richard Stumpf, an oceanographer who studies red tides for the National Oceanic and Atmospheric Administration (NOAA).
For reasons not well understood, strong northerly winds that normally break up a red tide by December failed to materialize last winter, Stumpf said.
It remains to be seen whether a single year of altered wind patterns will turn out to be an isolated deviation or part of more long-term changes in climate, Stumpf said.
But scientists say red tides in and of themselves are a natural phenomenon observed as far back as the 1600s.
For humans, exposure can cause respiratory difficulties, burning eyes and skin irritation. The toxins are often fatal to marine life.
The latest bloom coincided with the spawning season for snook, an ecologically important and popular game fish in Florida, Crosby said. A portion of emergency funding ordered by the governor is earmarked for assessing impacts on that fish.
Reporting by Steve Gorman in Los Angeles; additional reporting by Bernie Woodall in Fort Lauderdale, Florida; editing by Bill Tarant and Leslie Adler
Scientific publications, therapeutic breakthroughs and cultural endorsements suggest that the historical reputation of psychedelics — such as lysergic acid diethylamide (LSD), mescaline (from the peyote cactus) and psilocybin (mushrooms) — as dangerous or inherently risky have unfairly overshadowed a more optimistic interpretation.
Recent publications, like Michael Pollan’s How to Change your Mind, showcase the creative and potentially therapeutic benefits that psychedelics have to offer — for mental health challenges like depression and addiction, in palliative care settings and for personal development.
I am a medical historian, exploring why we now think that psychedelics may have a valuable role to play in human psychology, and why over 50 years ago, during the heyday of psychedelic research, we rejected that hypothesis. What has changed? What did we miss before? Is this merely a flashback?
Osmond studied mescaline from the peyote cactus, synthesized by German scientists in the 1930s, and LSD, a laboratory-produced substance created by Albert Hofmann at Sandoz in Switzerland. During the 1950s and into the 1960s, more than 1,000 scientific articles appeared as researchers around the world interrogated the potential of these psychedelics for healing addictions and trauma.
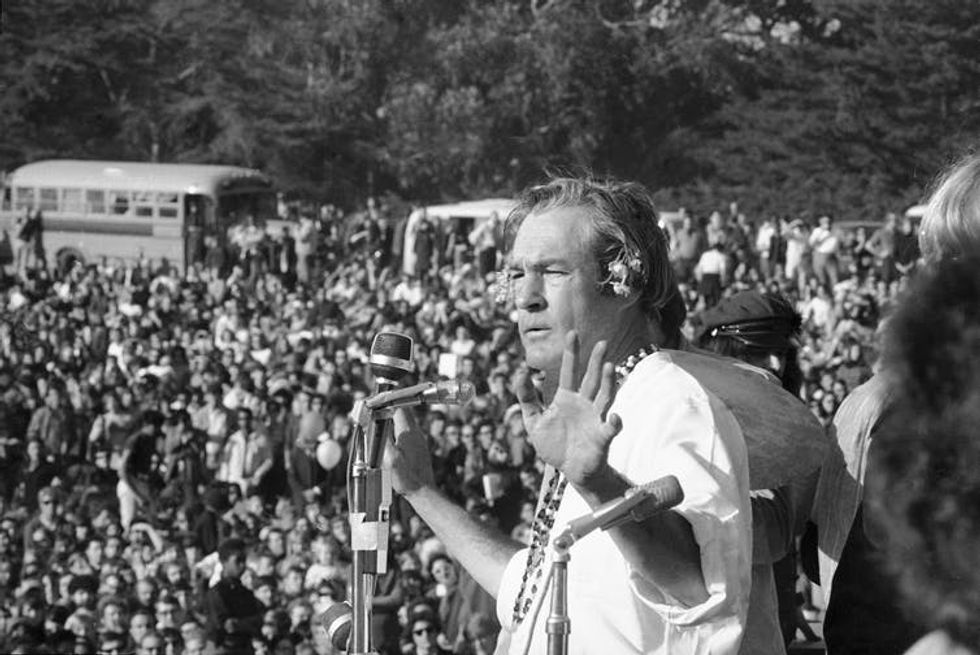
In this January 1967 file photo, Timothy Leary addresses a crowd of hippies at the ‘Human Be-In’ that he helped organize in Golden Gate Park, San Francisco, Calif.
(AP Photo/Bob Klein)
But, by the end of the 1960s, most legitimate psychedelic research ground to a halt. Some of the research had been deemed unethical, namely mind-control experiments conducted under the auspices of the CIA. Other researchers had been discredited for either unethical or self-aggrandizing use of psychedelics, or both.
In this April 2010 photo, one gram of psilocybin is seen on a scale at New York University, where a study investigated the effects of hallucinogenic drugs on the emotional and psychological state of advanced cancer patients.
(AP Photo/Seth Wenig)
In 2017, Oakland, Calif., hosted the largest gathering to date of psychedelic scientists and researchers. Boasting attendance of more than 3,000 participants, Psychedelic Science 2017 brought together researchers and practitioners with a diverse set of interests in reviving psychedelics — from filmmakers to neuroscientists, journalists, psychiatrists, artists, policy advisers, comedians, historians, anthropologists, Indigenous healers and patients.
As a historian, however, I am trained to be cynical about trends that claim to be new or innovative. We learn that often we culturally tend to forget the past, or ignore the parts of the past that seem beyond our borders.
For that reason, I am particularly interested in understanding the so-called psychedelic renaissance and what makes it different from the psychedelic heyday of the 1950s and 1960s.
The historic trials were conducted at the very early stages of the pharmacological revolution, which ushered in new methods for evaluating efficacy and safety, culminating in the randomized controlled trial (RCT). Prior to standardizing that approach, however, most pharmacological experiments relied on case reports and data accumulation that did not necessarily involve blinded or comparative techniques.
Shaman Pablo Flores pours ayahuasca into a plastic cup during a sacred ceremony in the Peruvian Jungle in May 2018.
(AP Photo/Martin Mejia)
Historically, scientists were keen to separate pharmacological substances from their organic cultural, spiritual and healing contexts — the RCT is a classic representation of our attempts to measure reaction rather than to interpret experience. Isolating the drug from an associated ritual might have more readily conveyed an image of progress, or a more genuine scientific approach.
Modern science has focused attention on data accrual — measuring reactions, identifying neural networks and discovering neuro-chemical pathways. It has moved decidedly away from larger philosophical questions of how we think, or what is human consciousness or how human thoughts are evolving.
We may now have more sophisticated tools for advancing the science of psychedelics. But psychedelics have always inspired harmony between brain and behaviour, individuals and their environments, and an appreciation for western and non-western traditions mutually informing the human experience.
In other words, scientific pursuits need to be coupled with a humanist tradition — to highlight not just how psychedelics work, but why that matters.
A state of emergency has been declared in Florida as the worst red tide in a decade blackens the ocean water, killing dolphins, sea turtles and fish at a relentless pace.
More than 100 tons of dead sea creatures have been shoveled up from smelly, deserted beaches in tourist areas along Florida's southwest coast this month alone.
In just the past week, 12 dolphins washed ashore dead in Sarasota County, typically the toll seen in an entire year.
"It is physically and mentally exhausting," said Gretchen Lovewell, who is in charge of a skeleton crew at Mote Marine Laboratory that collects dead or distressed sea turtles and marine mammals.
She and two colleagues "have been literally working around the clock," Lovewell added.
On Sunday, near the fluffy sands of Siesta Key, one of America's top-ranked beaches, Lovewell recovered the remains of a decomposing dolphin. A faint number, 252, was visible, freeze-branded onto its dorsal fin.
It was a 12-year-old male named Speck, who had been spotted more than 300 times by researchers monitoring generations of bottlenose dolphins in the Sarasota Bay.
"It was devastating," said Randall Wells, director of the Chicago Zoological Society's Sarasota Dolphin Research Program, the world's longest-running study of a wild dolphin population, under way since 1970.
Wells pulled out a map showing where researchers have seen Speck over the years. He often swam in waters right near Wells' own home.
Researchers had also tracked Speck's mother and grandmother before they died from swallowing fishing gear.
"Speck is somebody we have known from the time he was born," said Wells, who began studying dolphins when he was 16.
"He was named after my dad."
- How red tide kills -
Sarasota Dolphin Research Program/AFP / HOSpeck, a bottlenose dolphin and apparent victim of Florida's red tide, swims merrily in this 2015 picture released by the Sarasota Dolphin Research Program
Red tide is suspected as the cause of Speck's death, but researchers won't know for certain until lab results come back in the next few weeks.
A natural phenomenon, red tide is caused by a microscopic single-celled organism called Karenia brevis, unique to the Gulf of Mexico. It releases a powerful neurotoxin that can become airborne, causing headaches, watery eyes, coughing and asthma attacks in people.
Ecologists say the organism acts like a forest fire, clearing out weeds and allowing the landscape to start anew.
Karenia brevis is found year-round at low levels.
But once it multiplies, sea turtles and manatees may inhale it, or die from eating too much neurotoxin-laced fish and sea grass. Symptoms include disorientation, lack of coordination, and seizures.
Red tide has been documented as far back as the 1500s by Spanish explorers.
"But the question now is what might we be doing to enhance it and make it stay longer?" said Richard Pierce, a senior scientist at Mote Marine Laboratory and expert in ecotoxins.
Florida's current spate of red tide began in October 2017, but grew considerably worse in recent weeks.
Sometimes expanding and other times ebbing, it has descended on the west coast of Florida from Tampa to Naples, a nearly 200-mile (320-km) span.
Industrial farming and improper waste treatment can foster the growth of toxic blue-green algae, or cyanobacteria, another problem plaguing Florida waters.
The same may hold true for red tide, experts say.
- Blow to tourism -
The smell of rotting fish has been a gut punch to Florida's economy, sapping millions in revenue from fishing and tourism in peak season.
"Our life is tourism here in southwest Florida," said Omar Botana, owner of Bay Water boat rentals in Bonita Springs.
"It's hurt our business I'd say around 40 percent."
Residents hope that lawmakers and government officials will take action on restoring water flow southward through the Everglades, building inland reservoirs where pollutants can seep out before reaching the coast, and cutting back on fertilizers.
In the meantime, there is no end in sight to the current red tide outbreak.
Wells recalled that dolphins continued to suffer once the last major outbreak of red tide in 2005-2006 had ended.
Only a couple of local dolphins were suspected to have died from red tide toxins that time.
But fish populations were decimated. Hungry dolphins are more likely to seek an easy meal on the end of a fishing line, and risk ending up dead themselves.
When the young naturalist Alfred R. Wallace left England to explore the New World in 1848, one of his key observations in the Amazon region was that large rivers were unsurpassable barriers for some species of animals, particularly primates and birds. Even more interesting, he noticed that closely related species often occupied forests on opposite sides of a river, but they were never found together.
Indeed, there are hundreds of examples of cross-river pairs among Amazonian birds, a phenomenon not seen anywhere else on Earth. Nearly one-third of the approximately 240 bird species that normally inhabit the forests on one side of the lower Rio Negro in Brazil are replaced by a closely related species on the other side. For example, on the left bank you will see Black-spotted Barbets (Capito niger) with red throats. On the right bank you will only see the closely related Guilded Barbets (Capito auratus) with orange throats.
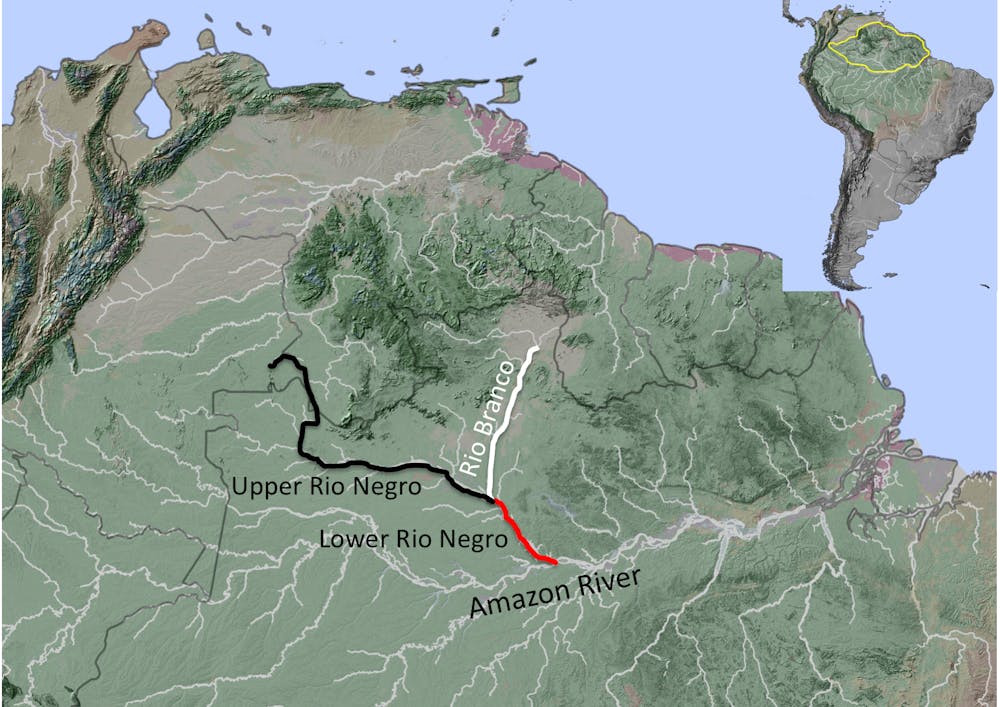
The Black-spotted and Guilded Barbets live apart, separated by the lower Rio Negro and the Rio Branco in the Brazilian Amazon.
Amazonian rivers have fascinated me since I first visited the region in 1999 and have been the main focus of my research as a tropical biologist. I was captivated by the replacement patterns Wallace described, and spent countless hours studying avian distribution maps.
Despite years of study, however, evolutionary biologists remain uncertain of the role rivers have played in the speciation process in Amazonia. Do rivers generate new species? Or simply act as secondary barriers, providing natural boundaries for species formed elsewhere? Did all these paired lineages diverge at the same time, divided by a common barrier? Or did each species follow its own evolutionary path?
The study focused on bird species whose distributions are bounded by two biogeographical barriers: the Rio Negro and the Rio Branco, located in the Guiana Shield in northern Amazonia.
These were the questions that guided my colleagues and me when we set out to explore the Rio Negro, still one of the most pristine regions of Amazonia. Like expeditions conducted by earlier naturalists, ours involved long boat journeys to reach remote locations. But we were armed with computers, digital imagery, GPS devices, digital audio recorders and liquid nitrogen to keep our samples at very low temperatures until we could perform genetic analysis back in the lab. Our plan was to use tissue samples from birds on opposite sides of the river to assess their evolutionary history.
Evolving from one species to two
By looking at the amount of genetic differentiation between individuals on different banks, modern naturalists are able to track down approximately how much time has passed since these populations began their independent evolutionary histories. What biologists cannot agree upon is what role these rivers played in the evolutionary history of the species they currently divide.
One obvious possibility is that the range of the ancestral species was dissected by a newly formed river, isolating big chunks of forests. Cutoff populations would slowly change and differentiate from one another. Given enough time, their differences would become great enough that they’d no longer recognize each other as potential mates with which to pair and raise offspring – they’d become different species. This idea became known as the riverine barrier hypothesis. It’s the oldest explanation for why there are so many species in Amazonia.
An alternative model suggests that rivers act as secondary barriers. According to this idea, although they’re currently important to define species’ geographical limits, rivers had nothing to do with the initial separation of that ancestral population.
It’s hard not to ask the most obvious question here, though. Birds engage in epic long-distance migrations and are able to travel from pole to pole. How in the world could an Amazonian river, even a large one, represent much of a barrier? Can’t birds simply fly across the river, reunite with their relatives and avoid becoming two different species?
The short answer is, apparently not. For many forest-dwelling species, rivers really do seem to be insurmountable barriers. Experiments suggest that many bird species are not capable of flying even a hundred yards over open landscape, let alone crossing several kilometers of a mighty Amazonian river
Testing the role of rivers in avian evolution
Our first step was to map the exact location of these pair replacements upriver. All the pairs studied were known to turnover across the lower Rio Negro, which ranges as wide as 10 kilometers in some places. Upriver, however, the river is much narrower and replacement patterns become more complicated, involving minor rivers.
When differences between populations are relatively large – like plumage patterns, colors or song – pairs are often considered different species. When differences are subtle – such as size or feather hue or tone – ornithologists tend to consider them different subspecies. Whether pairs of species or pairs of subspecies, biologists refer to them as “pairs of taxa.”
We investigated in detail 74 pairs of taxa whose ranges were divided by various combinations of the Rio Negro and its largest tributary, the Rio Branco. These two rivers are both biogeographical barriers for dozens of avian species. After more than a decade of fieldwork, and with the contribution of major Brazilian and U.S. museums and collections, our team had obtained distributional and genetic data for almost all bird species and subspecies that differed on either side of the river.
We reasoned that if a river dissected the landscape and separated many avian populations at the same time, pairs should present roughly similar times of divergence. If rivers acted as secondary barriers, pairs will likely present a whole suite of ages. In this case, pairs could be older than the rivers that currently bound their distributions, since according to this model, the original division of a species in two doesn’t depend on the emergence of the river.
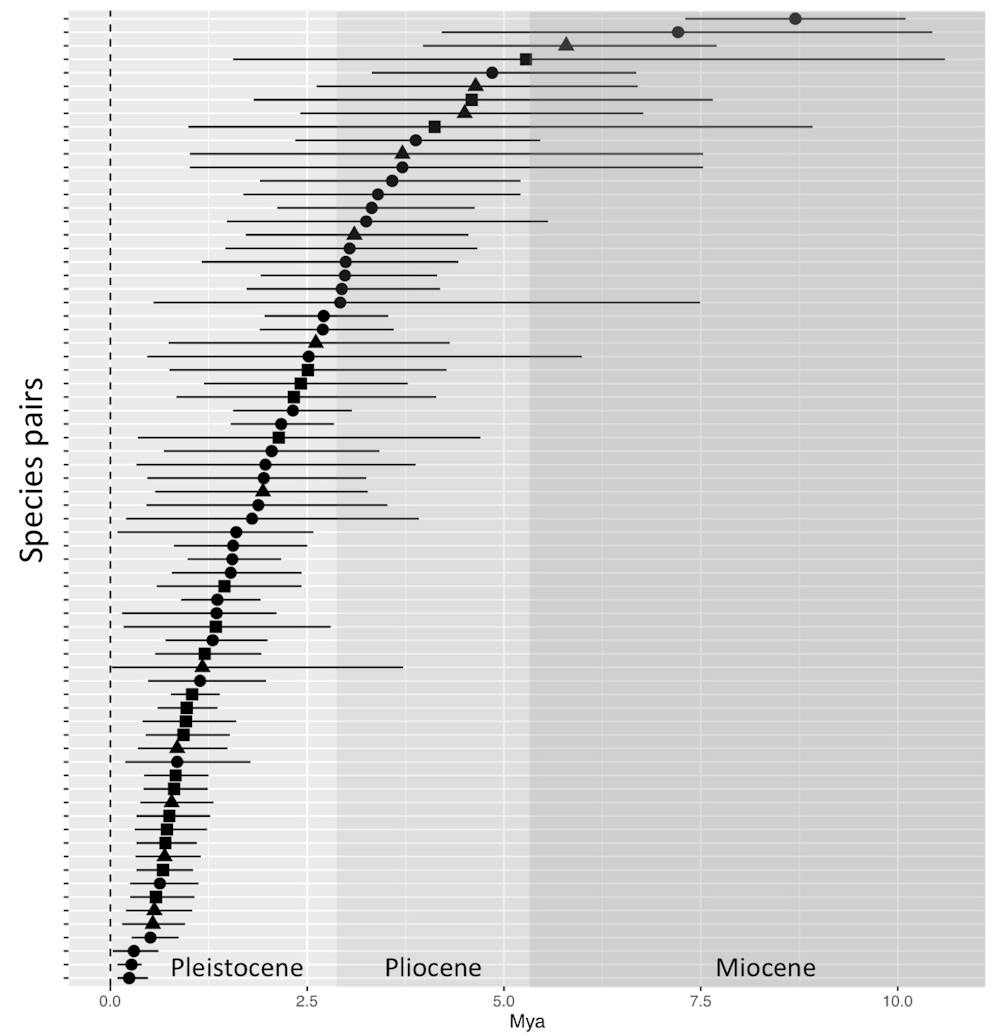
Researchers used molecular data to determine how long ago each of 74 bird pairs diverged. Horizontal bars cover credible intervals, taking timing uncertainties into account. Most pairs separated long before the two rivers existed in their present forms.
We used time-calibrated molecular data to figure out approximately when each of our 74 pairs of related birds went their separate ways, evolutionarily. Some genes mutate at predictable, steady rates, allowing scientists to estimate the time that’s elapsed since any given pair of organisms diverged. The more changes in their genomes, the longer it’s been since they shared a common ancestor. It’s like looking at what researchers call a “molecular clock.”
The Guianan Toucanet (Selenidera piperivora), is replaced by the Tawny-tufted Toucanet (S. nattereri) in this region. This is the oldest pair in the analysis, separated around 8 million years ago. Luciano Nicolas Naka, CC BY-ND
When we looked at the molecular clocks of our bird samples, we found that divergence events were not clustered within a particular time frame. Instead they ranged from 0.2 to 8 million years By ago. So it’s unlikely that all avian pairs currently divided by a common barrier, such as the Negro or the Branco, were generated by the genesis of those rivers.
Furthermore, geomorphological data suggest that these rivers established their current positions relatively recently. Approximate dates for the Rio Negro are around a million years, whereas the Rio Branco is apparently much more recent, around 20,000 years. Therefore, both rivers seem to be much younger than most bird pairs they currently divide, supporting the secondary contact barrier model: The rivers today maintain a boundary, but the timing suggests they couldn’t have been responsible for initially separating most of the avian pairs we studied.
On the other hand, the Rio Negro does appear to have a million-year history here. Our models cannot reject a common diversification event happening at around that age for 12 pairs of avian taxa, whose DNA indicated they’d diverged within the last million years. So while the origin of most pairs studied is likely not related to the genesis of the rivers, it is possible that the Rio Negro, in particular, represented a primary barrier for some species.
Our new study, published in Science Advances, offers compelling evidence that Amazonian rivers may hold a dual evolutionary role. They can act as primary barriers for some lineages, as proposed by the riverine barrier hypothesis. But more frequently, they act as secondary barriers for most avian lineages. These results come from only one, albeit important, Amazonian region, and similar studies from other basins will place our results into a broader context.
In a Twitter account called So Sad Today, the American writer Melissa Broder has been sending out snippets of her daily inner life since 2012. Broder writes about mundane sadness – ‘waking up today was a disappointment’ or ‘what you call a nervous breakdown i call oops, accidentally saw things as they are’– and she is brutally honest about her own shortcomings (‘whoops, hurt myself conforming to socially accepted standards of beauty that i know are false but still feel compelled to fit into’ or ‘just felt a flicker of self-esteem and was like what the fuck is this’). The account has become a sensation, winning her more than 675,000 followers, and Broder’s book of personal essays about her mental-health battles, also named So Sad Today, appeared in 2016.
It’s startling that Broder’s unabashed expression of sadness – and all the shitty emotions – has struck such a nerve in a world where people’s social media profiles are immaculately curated to show their happiest selves. But clearly the growing rates of depression worldwide mean that we are struggling to be happy. Are we doing something wrong? Broder’s popularity should compel us to cast a new look at sadness and its cousins. Perhaps we should consider realigning ourselves with the Romantics, who as a group found solace in freely expressing emotions in poetry. In his ‘Ode on Melancholy’ (1820), for example, John Keats wrote: ‘Ay, in the very temple of Delight, / Veil’d Melancholy has her sovran shrine’. Pain and joy are two sides of the same coin – both are necessary for a fully lived life.
Keats might have had Robert Burton in mind here, the 17th-century priest and scholar whose hefty volume The Anatomy of Melancholy (1621) described how sadness might go into overdrive (something we’ve come to understand as clinical depression) and how to cope with it. Or various self-help books from the 16th century, which, according to Tiffany Watt Smith, a research fellow at the Centre for the History of the Emotions at Queen Mary University of London, ‘try to encourage sadness in readers by giving them lists of reasons to be disappointed’. Could it be that the path leading to true happiness goes via sadness?
Recent research suggests that experiencing not-so-happy feelings actually promotes psychological wellbeing. A study published in the journal Emotion in 2016 took 365 German participants aged 14 to 88. For three weeks, they were handed a smartphone that put them through six daily quizzes on their emotional health. The researchers checked in on their feelings – be they negative or positive moods – as well as how they perceived their physical health in a given moment.
Prior to these three weeks, the participants had been interviewed about their emotional health (the extent to which they felt irritable or anxious; how they perceived negative moods), their physical health and their habits of social integration (did they have strong relationships with people in their lives?) After the smartphone task was over, they were quizzed about their life satisfaction.
The team found that the link between negative mental states and poor emotional and physical health was weaker in individuals who considered negative moods as useful. Indeed, negative moods correlated with low life satisfaction only in people who did not perceive adverse feelings as helpful or pleasant.
These results resonate with the experience of clinicians. ‘It is often not one’s initial response to a situation (the primary emotion) that is problematic, but their reaction to that response (the secondary emotion) that tends to be the most difficult,’ says Sophie Lazarus, a psychologist at the Ohio State University Wexner Medical Center. ‘This is because we are often sent messages that we shouldn’t feel negative emotions, so people are highly conditioned to want to change or get rid of their emotions, which leads to suppression, rumination, and/or avoidance.’
According to Brock Bastian, author of The Other Side of Happiness: Embracing a More Fearless Approach to Living (2018) and a psychologist at the University of Melbourne in Australia, the problem is partly cultural: a person living in a Western country is four to 10 times more likely to experience clinical depression or anxiety in a lifetime than an individual living in an Eastern culture. In China and Japan, both negative and positive emotions are considered an essential part of life. Sadness is not a hindrance to experiencing positive emotions and – unlike in Western society – there isn’t a constant pressure to be joyful.
This thinking could be rooted in religious upbringing. For example, Indo-Tibetan Buddhist philosophy, which has been extensively studied by Western psychologists such as Paul Ekman, calls for recognising emotions and embracing pain as part of the human condition. It places emphasis on understanding the nature of pain and the reasons that lead to it. Many modern psychological practices such as dialectical behaviour therapy now employ this approach of recognising and naming emotions in treating depression and anxiety.
In a study published in 2017, Bastian and his colleagues conducted two experiments examining how this societal expectation to seek happiness affects people, especially when they face failure. In the first study, 116 college students were divided into three groups to perform an anagram task. Many of the anagrams were impossible to solve. The test was designed for everyone to fail, but only one of the three groups was told to expect failure. Another group was in a ‘happy room’ whose walls were affixed with motivational posters and cheerful Post-it notes and they were provided with wellness literature, while the final group was given a neutral room.
After completing the task, all the participants took a worry test that measured their responses to failing the anagram task, and filled out a questionnaire designed to evaluate whether societal expectations to be happy affected how they processed negative emotions. They also took a test about their emotional state at that time. Bastian and his team found that people in the ‘happy room’ worried a lot more about their failure than the people in the other two rooms. ‘The idea is that when people find themselves in a context (in this case a room, but generally in cultural context) where happiness is highly valued, it sets up a sense of pressure that they should feel that way,’ Bastian told me. Then, when they experience failure, they ‘ruminate about why they are not feeling the way they think they should be feeling’. The rumination, the researchers found, worsened their state of mind.
In the second experiment, 202 people filled out two questionnaires online. The first one asked how often and how intensely they experienced sadness, anxiety, depression and stress. The second – in which people were asked to rate sentences such as: ‘I think society accepts people who feel depressed or anxious’ – measured to what extent societal expectations to seek positive feelings and inhibit negative ones affected their emotional state. As it turns out, people who thought that society expects them to always be cheerful and never sad experienced negative emotional states of stress, anxiety, depression and sadness more often.
Painful times confer other benefits that make us happier over the long term. It is during adversity that we connect most closely with people, Bastian points out. Experiencing adversity also builds resilience. ‘Psychologically, you can’t become tough if you don’t have to deal with tough things in life,’ he told me. At the same time, he warns that the recent findings shouldn’t be misunderstood. ‘The point is not that we should try and be sadder in life,’ he says. ‘The point is that when we try and avoid sadness, see it as a problem, and strive for endless happiness, we are in fact not very happy and, therefore, cannot enjoy the benefits of true happiness.’
By Dinsa Sachan
This article was originally published at Aeon and has been republished under Creative Commons.
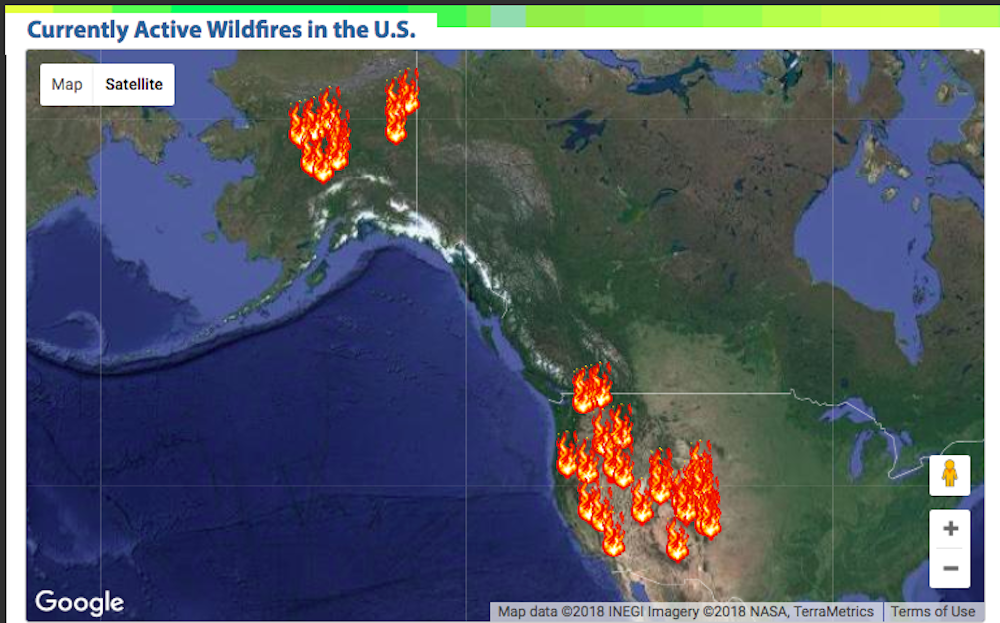
These burn forests, houses and other structures, displace thousands of people and animals, and cause major disruptions in people’s lives. The huge burden of simply firefighting has become a year-round task costing billions of dollars, let alone the cost of the destruction. The smoke veil can extend hundreds or even thousands of miles, affecting air quality and visibility. To many people, it has become very clear that human-induced climate change plays a major role by greatly increasing the risk of wildfire.
Yet it seems the role of climate change is seldom mentioned in many or even most news stories about the multitude of fires and heat waves. In part this is because the issue of attribution is not usually clear. The argument is that there have always been wildfires, and how can we attribute any particular wildfire to climate change?
As a climate scientist, I can say this is the wrong framing of the problem. Global warming does not cause wildfires. The proximate cause is often human carelessness (cigarette butts, camp fires not extinguished properly, etc.), or natural, from “dry lightning” whereby a thunderstorm produces lightning but little rain. Rather, global warming exacerbates the conditions and raises the risk of wildfire.
Even so, there is huge complexity and variability from one fire to the next, and hence the attribution can become complex. Instead, the way to think about this is from the standpoint of basic science – in this case, physics.
This year is proving to be another active wildfire season.
To understand the interplay between global warming and wildfires, consider what’s happening to our planet.
The composition of the atmosphere is changing from human activities: There has been over a 40 percent increase in carbon dioxide, mainly from fossil fuel burning since the 1800s, and over half of the increase is since 1985. Other heat-trapping gases (methane, nitrous oxide, etc.) are also increasing in concentration in the atmosphere from human activities. The rates are accelerating, not declining (as hoped for with the Paris agreement).
The flows of energy through the climate system are schematically illustrated with numbers on the top-of-atmosphere values and net energy imbalance at the surface.
Trenberth et al 2009
Heat-trapping gases in the atmosphere act as a blanket and inhibit the infrared radiation – that is, heat from the Earth – from escaping back into space to offset the continual radiation coming from the sun. As these gases build up, more of this energy, mostly in the form of heat, remains in our atmosphere. The energy raises the temperature of the land, oceans and atmosphere, melts ice, thaws permafrost, and fuels the water cycle through evaporation.
Moreover, we can estimate Earth’s energy imbalance quite well: It amounts to about 1 watt per square meter, or about 500 terawatts globally.
While this factor is small compared with the natural flow of energy through the system, which is 240 watts per square meter, it is large compared with all other direct effects of human activities. For instance, the electrical power generation in the U.S. last year averaged 0.46 terawatts.
The extra heat is always the same sign and it is spread across the globe. Accordingly, where this energy accumulates matters.
Heat also accumulates in melting ice, causing melting Arctic sea ice and glacier losses in Greenland and Antarctica. This adds water to the ocean, and so the sea level rises from this as well, rising at a rate of over 3 milimeters year, or over a foot per century.
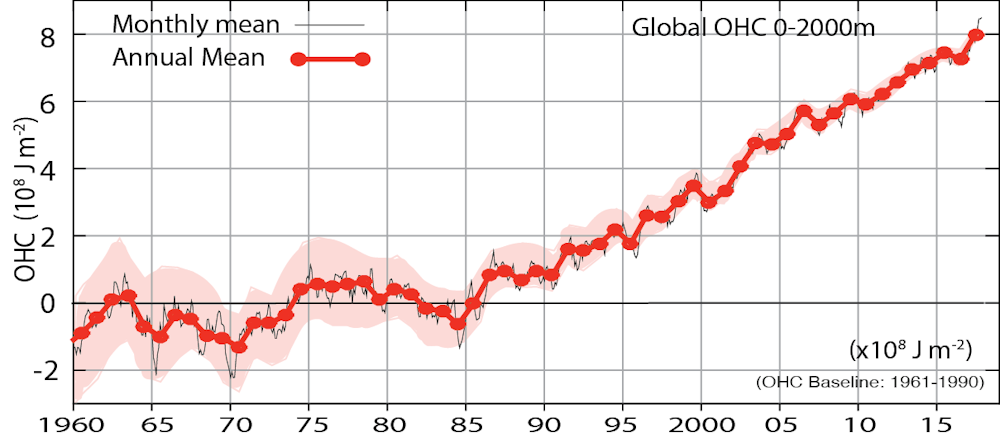
Global ocean heat content for the top 2000 meters of the ocean, with uncertainty estimates by the pink region.
On land, the effects of the energy imbalance are complicated by water. If water is present, the heat mainly goes into evaporation and drying, and that feeds moisture into storms, which produce heavier rain. But the effects do not accumulate provided that it rains on and off.
However, in a dry spell or drought, the heat accumulates. Firstly, it dries things out, and then secondly it raises temperatures. Of course, “it never rains in southern California” according to the 1970s pop song, at least in the summer half year.
So water acts as the air conditioner of the planet. In the absence of water, the excess heat effects accumulate on land both by drying everything out and wilting plants, and by raising temperatures. In turn, this leads to heat waves and increased risk of wildfire. These factors apply in regions in the western U.S. and in regions with Mediterranean climates. Indeed many of the recent wildfires have occurred not only in the West in the United States, but also in Portugal, Spain, Greece, and other parts of the Mediterranean.
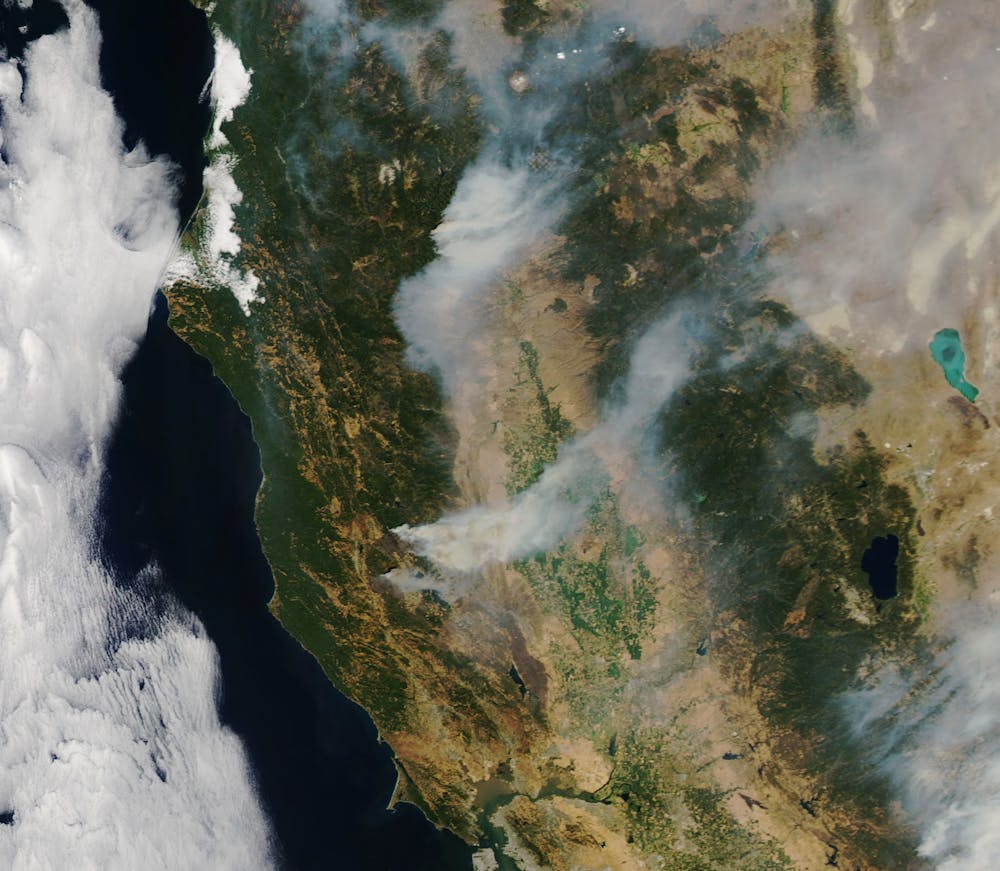
A satellite image of the Carr Fire in California. Drought conditions, in addition to a lot of dead trees and vegetation, are contributing to another year of severe wildfires.
The conditions can also develop in other parts of the world when strong high pressure weather domes (anticyclones) stagnate, as can happen in part by chance, or with increased odds in some weather patterns such as those established by either La Niña or El Niño events (in different places). It is expected that these dry spots move around from year to year, but that their abundance increases over time, as is clearly happening.
How big is the energy imbalance effect over land? Well, 1 Watt per square meter over a month, if accumulated, is equivalent to 720 Watts per square meter over one hour. 720 Watts is equivalent to full power in a small microwave oven. One square meter is about 10 square feet. Hence, after one month this is equivalent to: one microwave oven at full power every square foot for six minutes. No wonder things catch on fire!
Attribution science
Coming back to the original question of wildfires and global warming, this explains the argument: there is extra heat available from climate change and the above indicates just how large it is.
In reality there is moisture in the soil, and plants have root systems that tap soil moisture and delay the effects before they begin to wilt, so that it typically takes over two months for the effects to be large enough to fully set the stage for wildfires. On a day to day basis, the effect is small enough to be lost in the normal weather variability. But after a dry spell of over a month, the risk is noticeably higher. And of course the global mean surface temperature is also going up.
“We can’t attribute a single event to climate change” has been a mantra of climate scientists for a long time. It has recently changed, however.
As in the wildfires example, there has been a realization that climate scientists may be able to make useful statements by assuming that the weather events themselves are relatively unaffected by climate change. This is a good assumption.
Also, climate scientists cannot say that extreme events are due to global warming, because that is a poorly posed question. However, we can say it is highly likely that they would not have had such extreme impacts without global warming. Indeed, all weather events are affected by climate change because the environment in which they occur is warmer and moister than it used to be.
In particular, by focusing on Earth’s Energy Imbalance, new research is expected to advance the understanding of what is happening, and why, and what it implies for the future.
These burn forests, houses and other structures, displace thousands of people and animals, and cause major disruptions in people’s lives. The huge burden of simply firefighting has become a year-round task costing billions of dollars, let alone the cost of the destruction. The smoke veil can extend hundreds or even thousands of miles, affecting air quality and visibility. To many people, it has become very clear that human-induced climate change plays a major role by greatly increasing the risk of wildfire.
Yet it seems the role of climate change is seldom mentioned in many or even most news stories about the multitude of fires and heat waves. In part this is because the issue of attribution is not usually clear. The argument is that there have always been wildfires, and how can we attribute any particular wildfire to climate change?
As a climate scientist, I can say this is the wrong framing of the problem. Global warming does not cause wildfires. The proximate cause is often human carelessness (cigarette butts, camp fires not extinguished properly, etc.), or natural, from “dry lightning” whereby a thunderstorm produces lightning but little rain. Rather, global warming exacerbates the conditions and raises the risk of wildfire.
Even so, there is huge complexity and variability from one fire to the next, and hence the attribution can become complex. Instead, the way to think about this is from the standpoint of basic science – in this case, physics.
This year is proving to be another active wildfire season.
To understand the interplay between global warming and wildfires, consider what’s happening to our planet.
The composition of the atmosphere is changing from human activities: There has been over a 40 percent increase in carbon dioxide, mainly from fossil fuel burning since the 1800s, and over half of the increase is since 1985. Other heat-trapping gases (methane, nitrous oxide, etc.) are also increasing in concentration in the atmosphere from human activities. The rates are accelerating, not declining (as hoped for with the Paris agreement).
The flows of energy through the climate system are schematically illustrated with numbers on the top-of-atmosphere values and net energy imbalance at the surface.
Trenberth et al 2009
Heat-trapping gases in the atmosphere act as a blanket and inhibit the infrared radiation – that is, heat from the Earth – from escaping back into space to offset the continual radiation coming from the sun. As these gases build up, more of this energy, mostly in the form of heat, remains in our atmosphere. The energy raises the temperature of the land, oceans and atmosphere, melts ice, thaws permafrost, and fuels the water cycle through evaporation.
Moreover, we can estimate Earth’s energy imbalance quite well: It amounts to about 1 watt per square meter, or about 500 terawatts globally.
While this factor is small compared with the natural flow of energy through the system, which is 240 watts per square meter, it is large compared with all other direct effects of human activities. For instance, the electrical power generation in the U.S. last year averaged 0.46 terawatts.
The extra heat is always the same sign and it is spread across the globe. Accordingly, where this energy accumulates matters.
Heat also accumulates in melting ice, causing melting Arctic sea ice and glacier losses in Greenland and Antarctica. This adds water to the ocean, and so the sea level rises from this as well, rising at a rate of over 3 milimeters year, or over a foot per century.
Global ocean heat content for the top 2000 meters of the ocean, with uncertainty estimates by the pink region.
On land, the effects of the energy imbalance are complicated by water. If water is present, the heat mainly goes into evaporation and drying, and that feeds moisture into storms, which produce heavier rain. But the effects do not accumulate provided that it rains on and off.
However, in a dry spell or drought, the heat accumulates. Firstly, it dries things out, and then secondly it raises temperatures. Of course, “it never rains in southern California” according to the 1970s pop song, at least in the summer half year.
So water acts as the air conditioner of the planet. In the absence of water, the excess heat effects accumulate on land both by drying everything out and wilting plants, and by raising temperatures. In turn, this leads to heat waves and increased risk of wildfire. These factors apply in regions in the western U.S. and in regions with Mediterranean climates. Indeed many of the recent wildfires have occurred not only in the West in the United States, but also in Portugal, Spain, Greece, and other parts of the Mediterranean.
A satellite image of the Carr Fire in California. Drought conditions, in addition to a lot of dead trees and vegetation, are contributing to another year of severe wildfires.
The conditions can also develop in other parts of the world when strong high pressure weather domes (anticyclones) stagnate, as can happen in part by chance, or with increased odds in some weather patterns such as those established by either La Niña or El Niño events (in different places). It is expected that these dry spots move around from year to year, but that their abundance increases over time, as is clearly happening.
How big is the energy imbalance effect over land? Well, 1 Watt per square meter over a month, if accumulated, is equivalent to 720 Watts per square meter over one hour. 720 Watts is equivalent to full power in a small microwave oven. One square meter is about 10 square feet. Hence, after one month this is equivalent to: one microwave oven at full power every square foot for six minutes. No wonder things catch on fire!
Attribution science
Coming back to the original question of wildfires and global warming, this explains the argument: there is extra heat available from climate change and the above indicates just how large it is.
In reality there is moisture in the soil, and plants have root systems that tap soil moisture and delay the effects before they begin to wilt, so that it typically takes over two months for the effects to be large enough to fully set the stage for wildfires. On a day to day basis, the effect is small enough to be lost in the normal weather variability. But after a dry spell of over a month, the risk is noticeably higher. And of course the global mean surface temperature is also going up.
“We can’t attribute a single event to climate change” has been a mantra of climate scientists for a long time. It has recently changed, however.
As in the wildfires example, there has been a realization that climate scientists may be able to make useful statements by assuming that the weather events themselves are relatively unaffected by climate change. This is a good assumption.
Also, climate scientists cannot say that extreme events are due to global warming, because that is a poorly posed question. However, we can say it is highly likely that they would not have had such extreme impacts without global warming. Indeed, all weather events are affected by climate change because the environment in which they occur is warmer and moister than it used to be.
In particular, by focusing on Earth’s Energy Imbalance, new research is expected to advance the understanding of what is happening, and why, and what it implies for the future.
NASA counted down Friday to the launch of a $1.5 billion spacecraft that aims to plunge into the Sun's sizzling atmosphere and become humanity's first mission to explore a star.
The car-sized Parker Solar Probe is scheduled to blast off on a Delta IV Heavy rocket from Cape Canaveral, Florida early Saturday.
The 65-minute launch window opens at 3:33 am (0733 GMT), and the weather forecast is 70 percent favorable for takeoff, NASA said.
The probe's main goal is to unveil the secrets of the corona, the unusual atmosphere around Sun.
Not only is the corona about 300 times hotter than the Sun's surface, it also hurls powerful plasma and energetic particles that can unleash geomagnetic space storms and disrupt Earth's power grid.
"The Parker Solar Probe will help us do a much better job of predicting when a disturbance in the solar wind could hit Earth," said Justin Kasper, one of the project scientists and a professor at the University of Michigan.
- 'Full of mysteries' -
The probe is protected by an ultra-powerful heat shield that is just 4.5 inches thick (11.43 centimeters).
The shield should enable the spacecraft to survive its close shave with the center of our solar system, coming within 3.83 million miles (6.16 million kilometers) of the Sun's surface.
AFP / Gal ROMAProbing the sun
The heat shield is built to withstand radiation equivalent up to about 500 times the Sun's radiation here on Earth.
Even in a region where temperatures can reach more than a million degrees Fahrenheit, the sunlight is expected to heat the shield to just around 2,500 degrees Fahrenheit (1,371 degrees Celsius).
Scorching, yes? But if all works as planned, the inside of the spacecraft should stay a cooler 85 F (29 C).
The goal for the Parker Solar Probe is to make 24 passes through the corona during its seven-year mission.
"The sun is full of mysteries," said Nicky Fox, project scientist at the Johns Hopkins University Applied Physics Lab.
"We are ready. We have the perfect payload. We know the questions we want to answer."
- 91-year-old namesake -
The tools on board will measure the expanding corona and continually flowing atmosphere known as the solar wind, which solar physicist Eugene Parker first described back in 1958.
Parker, now 91, recalled that at first, some people did not believe in his theory.
But then, the launch of NASA's Mariner 2 spacecraft in 1962 -- becoming the first robotic spacecraft to make a successful planetary encounter -- proved them wrong.
"It was just a matter of sitting out the deniers for four years until the Venus Mariner 2 spacecraft showed that, by golly, there was a solar wind," Parker said earlier this week.
He added that he is "impressed" by the Parker Solar Probe, calling it "a very complex machine."
Scientists have wanted to build a spacecraft like this for more than 60 years, but only in recent years did the heat shield technology advance enough to be capable of protecting sensitive instruments, according to Fox.
Tools on board will measure high energy particles associated with flares and coronal mass ejections, as well as the changing magnetic field around the Sun.
"We will also be listening for plasma waves that we know flow around when particles move," Fox added.
"And last but not least, we have a white light imager that is taking images of the atmosphere right in front of the Sun."
When it nears the Sun, the probe will travel rapidly enough to go from New York to Tokyo in one minute -- some 430,000 miles (700,000 kilometers) per hour, making it the fastest human-made object.
There have been many studies and popular articles about the effect that fear-mongering has on people’s political attitudes since Donald Trump arrived on the scene. Fearful messages designed to make individuals feel that their existence or worldview is being threatened are powerful tools for politicians, and have been for a very long time.
But if there is one emotion that is currently more pervasive than fear among American citizens on both the political right and the left, it’s anger. It would not be a stretch of the imagination to say that right now the country is angrier and more divided than it has ever been in modern times.
Given its prevalence, an obvious question should be, “How is anger affecting people’s politics?” While the effects of fear on political bias are well-established at both the psychological and neural level, the consequences of anger—an emotion that is a bit more difficult to study experimentally—are just beginning to be understood.
A new study published in the journal Political Psychology has found that anger exacerbates political bias and causes individuals to be less open to any reasoning or evidence that isn’t in line with their political leanings, and more open to information that bolsters one’s current views. This is known as biased assimilation of political information, and political scientists Liz Suhay and Cengiz Erisen of American University set out to find under what conditions and to what extent emotions such as anger exacerbate the effect.
They did this by conducting an online study of U.S. citizens to confirm previous findings that established politically biased assimilation as a real and robust phenomenon, and to test how emotional states contribute to it, with a special emphasis on the role of anger. Participants’ attitudes on a political topic were measured by exposing them to arguments that were either congruent or incongruent with their self-identified political affiliation, and asking them to evaluate, counter, or support those arguments. To understand the role of emotion in mediating biased assimilation, after exposure to each argument participants were asked to rate the extent to which they experienced nine emotions—three in the anger domain (angry, outraged, disgusted), three in the anxiety domain (anxious, nervous, worried), and three in the enthusiasm domain (enthusiastic, hopeful, proud).
The experiment was successful in replicating prior results supporting the existence of biased assimilation of political information. Additionally, the results showed, as predicted, that the emotion of anger was a significant mediator of politically-biased assimilation of information, such that it strengthened 1) the bias toward evaluating ideologically-congruent arguments more favorably than incongruent ones, and 2) the tendency to counter-argue ideologically-dissimilar arguments more than similar ones. These effects were found to be significant in both Republicans and Democrats, with no statistical difference between the two.
This confirmed their hypothesis, based on past research on emotion, that anger plays a unique role in biased assimilation because it “orients thinking and action toward defending the self (and allies) and attacking components.” Given the prevalence of anger amongst Americans today, these findings offer some important implications and insights.
President Trump routinely uses rhetoric that incites anger in Americans on both sides of the political spectrum. For his supporters, his anti-immigrant and anti-Muslim rhetoric instills them with anger towards their perceived enemies, while the same rhetoric enrages his critics, whose anger is directed at Trump himself for many of his unsupported claims and manipulative hyperbole. Additionally, Trump is constantly fueling anger towards the media and liberals whenever he feels he is being treated unfairly, which has become an almost daily occurrence.
In light of Dr. Suhay’s results, this suggests that both conservatives and liberals are experiencing greater biased assimilation of political information, which is presumably polarizing America further and making it even more difficult for the two sides to find common ground. Beyond being generally bad for the nation, such political tactics can politically benefit Trump by solidifying his base, and pushing his opponents toward more extreme political stances that are less popular with the average voter.
Given these new findings, Americans could all benefit from staying calm and collected rather than getting their feathers ruffled over Trump’s hateful messages and appeals to tribalism, as it directly affects our ability to reason and evaluate new information accurately. By exacerbating political bias and polarization, anger only feeds the beast. Better to be happy and hopeful, so that it may starve to death.
Bobby Azarian is a neuroscientist affiliated with George Mason University and a freelance journalist. His research has been published in journals such as Cognition & Emotion and Human Brain Mapping, and he has written for The New York Times, The Atlantic, Psychology Today, and Scientific American. Follow him @BobbyAzarian.
Conservationists have designated August 12 as World Elephant Day to raise awareness about conserving these majestic animals. Elephants have many engaging features, from their incredibly dexterous trunks to their memory abilities and complex social lives.
But there is much less discussion of their brains, even though it stands to reason that such a large animal has a pretty big brain (about 12 pounds). Indeed, until recently very little was actually known about the elephant brain, in part because obtaining well-preserved tissue suitable for microscopic study is extremely difficult.
That door was opened by the pioneering efforts of neurobiologist Paul Manger at the University of the Witwatersrand in South Africa, who obtained permission in 2009 to extract and preserve the brains of three African elephants that were scheduled to be culled as part of a larger population management strategy. We have thus learned more about the elephant brain in the last 10 years than ever before.
My lab group has long been interested in the morphology, or shape, of neurons in the cerebral cortex of mammals. The cortex constitutes the thin, outer layer of neurons (nerve cells) that cover the two cerebral hemispheres. It is closely associated with higher cognitive functions such as coordinated voluntary movement, integration of sensory information, sociocultural learning and the storing of memories that define an individual.
These images illustrate the process of removing a small section of cerebral cortex from the right cerebral hemisphere of the elephant. This tissue is stained and placed on a glass slide so that, under the microscope, one can see individual neurons and trace them in three dimensions.
The arrangement and morphology of neurons in the cortex is relatively uniform across mammals – or so we thought after decades of investigations on human and nonhuman primate brains, and the brains of rodents and cats. As we found when we were able to analyze elephant brains, the morphology of elephant cortical neurons is radically different from anything we had ever observed before.
How neurons are visualized and quantified
The process of exploring neuronal morphology begins with staining brain tissue after it has been fixed (chemically preserved) for a period of time. In our laboratory we use a technique over 125 years old called the Golgi stain, named after Italian biologist and Nobel Laureate Camillo Golgi (1843-1926).
This methodology set the foundation of modern neuroscience. For example, Spanish neuroanatomist and Nobel Laureate Santiago Ramon y Cajal (1852-1934) used this technique to provide a road map of what neurons look like and how they are connected with each other.
The Golgi stain impregnates only a small percentage of neurons, allowing individual cells to appear relatively isolated with a clear background. This reveals the dendrites, or branches, that constitute the receptive surface area of these neurons. Just as branches on a tree bring in light for photosynthesis, the dendrites of neurons allow the cell to receive and synthesize incoming information from other cells. The greater the complexity of the dendritic systems, the more information a particular neuron can process.
Once we stain neurons, we can trace them in three dimensions under the microscope, with the help of a computer and specialized software, revealing the complex geometry of neuronal networks. In this study, we traced 75 elephant neurons. Each tracing took one to five hours, depending on the complexity of the cell.
What elephant neurons look like
Even after doing this kind of research for years, it remains exciting to look at tissue under the microscope for the first time. Each stain is a walk through a different neural forest. When we examined sections of elephant tissue, it was clear that the basic architecture of the elephant cortex was different from that of any other mammals that have been examined to date – including its closest living relatives, the manatee and the rock hyrax.
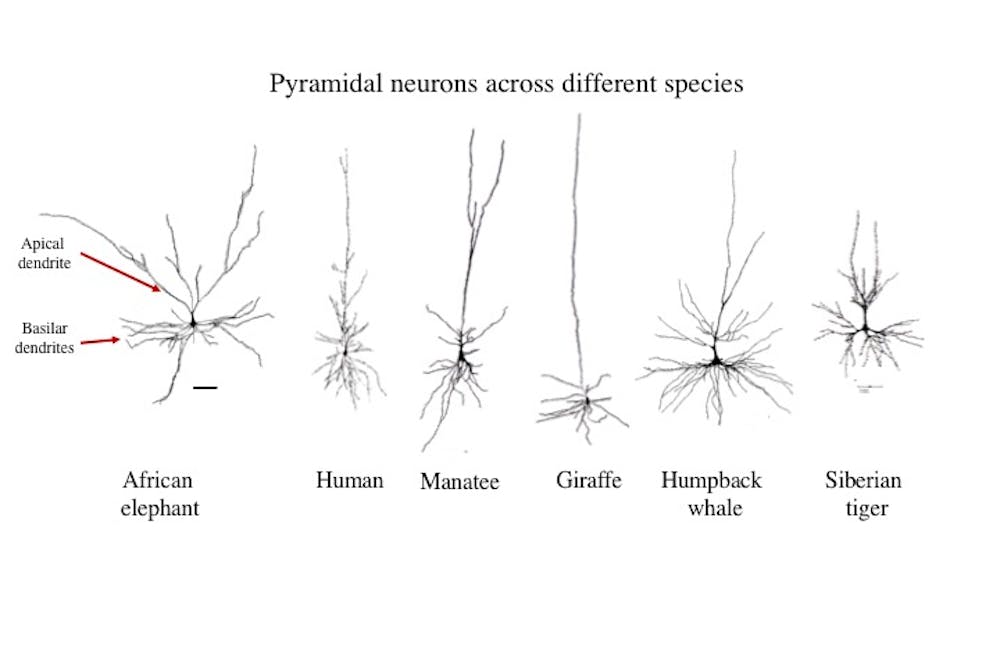
Tracings of the most common neuron (the pyramidal neuron) in the cerebral cortex of several species. Note that the elephant has widely branching apical dendrites, whereas all other species have a more singular, ascending apical dendrite. The scale bar = 100 micrometers (or 0.004 of an inch).
Here are three major differences that we found between cortical neurons in the elephant and those found in other mammals.
First, the dominant cortical neuron in mammals is the pyramidal neuron. These are also prominent in the elephant cortex, but they have a very different structure. Instead of having a singular dendrite that comes off the apex of the cell (known as an apical dendrite), apical dendrites in the elephant typically branch widely as they ascend to the surface of the brain. Instead of a single, long branch like a fir tree, the elephant apical dendrite resembles two human arms reaching upward.
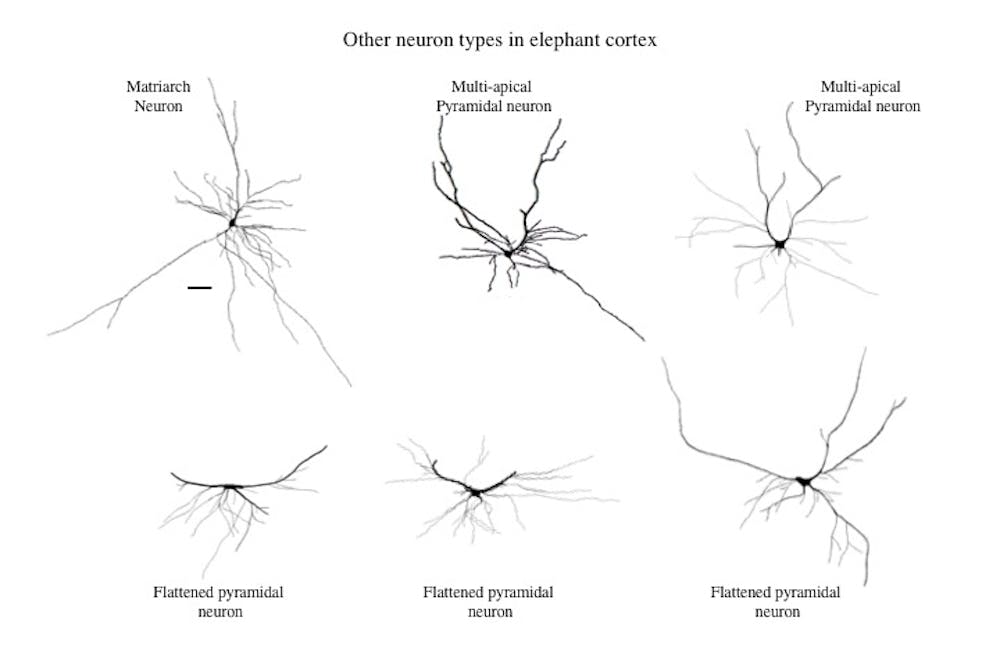
A variety of cortical neurons in the elephant that are seldom if ever observed in the cortex of other mammals. Note that all of them are characterized by dendrites that spread out from the cell body laterally, sometimes over considerable distances. The scale bar = 100 micrometers (or 0.004 of an inch).
Second, the elephant exhibits a much wider variety of cortical neurons than do other species. Some of these, such as the flattened pyramidal neuron, are not found in other mammals. One characteristic of these neurons is that their dendrites extend laterally from the cell body over long distances. In other words, like the apical dendrites of pyramidal cells, these dendrites also extend out like human arms uplifted to the sky.
Third, the overall length of pyramidal neuron dendrites in elephants is about the same as in humans. However, they are arranged differently. Human pyramidal neurons tend to have a large number of shorter branches, whereas the elephant has a smaller number of much longer branches. Whereas primate pyramidal neurons seem to be designed for sampling very precise input, the dendritic configuration in elephants suggests that their dendrites sample a very broad array of input from multiple sources.
Taken together, these morphological characteristics suggest that neurons in the elephant cortex may synthesize a wider variety of input than the cortical neurons in other mammals.
In terms of cognition, my colleagues and I believe that the integrative cortical circuitry in the elephant supports the idea that they are essentially contemplative animals. Primate brains, by comparison, seem specialized for rapid decision-making and quick reactions to environmental stimuli.
A tuskless matriarch elephant shows kindness toward young orphan elephants trying to find their way in the Kenyan bush.
The brains of all species are unique. Indeed, even the brains of individuals within a given species are unique. However, the special morphology of elephant cortical neurons reminds us that there is certainly more than one way to wire an intelligent brain.
When did animals originate? In research published in the journal Palaeontology, we show that this question is answered by Cambrian period fossils of a frond-like sea creature called Stromatoveris psygmoglena.
The Ediacaran Period lasted from 635 to 542m years ago. This era is key to understanding animal origins because it occurred just before the “Cambrian explosion” of 541m years ago, when many of the animal groups living today first appeared in the fossil record.
Yet when large fossils from the Ediacaran Period were first identified during the 20th century they included unique frond-like forms, which were not quite like any living animal. This prompted one of the greatest debates still raging in evolution. What exactly were these enigmatic fossils, often called the Ediacaran biota?
An Ediacaran fossil from the National Earth Science Museum, Namibia.
J. Hoyal Cuthill
Linking Ediacaran and Cambrian fossils
By comparing members of the Ediacaran biota to a range of other groups in a computer analysis of evolutionary relationships, we found that Stromatoveris psygmoglena provides a crucial link between the older period and the animals which appeared in startling number and diversity during the Cambrian period.
Fossils of Stromatoveris psygmoglena are found in only one place in the world: Chengjiang county, China. This region is known for exceptionally well-preserved Cambrian fossils from 518m years ago.
While the fossil record most often preserves only hard shells or bones, some special sites like Chengjiang preserve the remains of soft-bodied animals, such as Stromatoveris psygmoglena. Originally described in 2006 from eight known specimens, we examined over 200 new fossils of the organism that have since been discovered by researchers from Northwest University, China, and dated to the Cambrian period.
The way in which fossils of the Ediacaran Period were preserved has been another of their mysteries. These fossils often show signs of bending, twisting and tearing, suggesting that they preserve soft-bodied organisms without hard parts. However, there is rarely anything left of the soft tissues themselves.
Instead, they left moulds in the surrounding sediment, a little like a footprint on the beach. In contrast, the newly examined Cambrian fossils of Stromatoveris psygmoglena retain carbon-based tissue, allowing us to see the detailed and internal anatomy of the body itself.
A Cambrian fossil of Stromatoveris from Northwest University, China.
J. Hoyal Cuthill
During a research fellowship at the Tokyo Institute of Technology and the University of Cambridge, the new Cambrian period fossils of Stromatoveris psygmoglena were compared to earlier Ediacaran fossils in a computer analysis of anatomy and evolutionary relationships. This was also the first analysis to test the relationships between the Ediacaran biota and a range of other organisms, covering single-celled creatures called protozoans, algae, fungi, and nine types of animals, including Stromatoveris psygmoglena. This analysis used over 80 photographs of individual fossil specimens to compare anatomical features across these groups.
The analysis showed that Stromatoveris psygmoglena and seven key members of the Ediacaran biota share very similar anatomies, including multiple, branched fronds which radiate outwards like seaweed, uniting them all in a new group of early animals called Petalonamae. The name means “Nama Petals” and was chosen to honour biologist Hans Pflug and his work on the Ediacaran biota in Namibia, a reference to the petal-like fronds which, Pflug noted, distinguish these unusual animals.
Rethinking animal evolution
Uniting these members of the Ediacaran biota and Stromatoveris psygmoglena in a single group of animals has major implications for animal origins. In light of this new evidence, some older ideas on early animal evolution may need to be revised.
Because members of the Ediacaran biota can now be classed as animals, we can date the origin of the animal kingdom to at least the time when these fossils appeared. The oldest members of these groups are known as “rangeomorphs” and appear in the fossil record approximately 571m years ago, in the late Ediacaran Period.
The front view of a rangeomorph fossil, the oldest of the Ediacaran biota.
Jennifer Hoyal Cuthill, Author provided
This means that animal species were diversifying well before the Cambrian explosion. It may also mean that the search for animal origins should now focus on the time before this, in the early Ediacaran and even more ancient geological periods. Based on this, animals may have originated much earlier than the traditional reading of the fossil record had suggested.
This study also has key implications for the ecology and eventual extinction of the petalonamids. Many Ediacaran species have not been found in later rocks leading some researchers to think that they were a “failed experiment” in evolution, disappearing by the beginning of the Cambrian. Indeed, this was my own view until I saw the remarkable new fossils of Stromatoveris psygmoglena.
The inclusion of this Cambrian animal among the petalonamids changes the picture of the Ediacaran biota. Stromatoveris psygmoglena shows that the petalonamids were alive and well over 20m years into the Cambrian period and did not go extinct at its outset, as had been thought.
Even more intriguing, more than 200 fossils of Stromatoveris psygmoglena have now been found, despite the fact that it lacked hard parts which are usually most easily preserved. This indicates that this species was an important member of its shallow marine ecosystem rather than a rare or marginal survivor.
This could mean that the petalonamids adapted more successfully to the changes of the Cambrian period than had been thought, or that the Ediacaran period and its animals were less alien and more advanced than previously realised. We can be confident, however, that the animal kingdom we occupy is much older than we once thought.
Every summer the U.S. Central Plains go dry, leading farmers to tap into groundwater to irrigate sorghum, soy, cotton, wheat and corn and maintain large herds of cattle and hogs. As the heat rises, anxious irrigators gather to discuss whether and how they should adopt more stringent conservation measures.
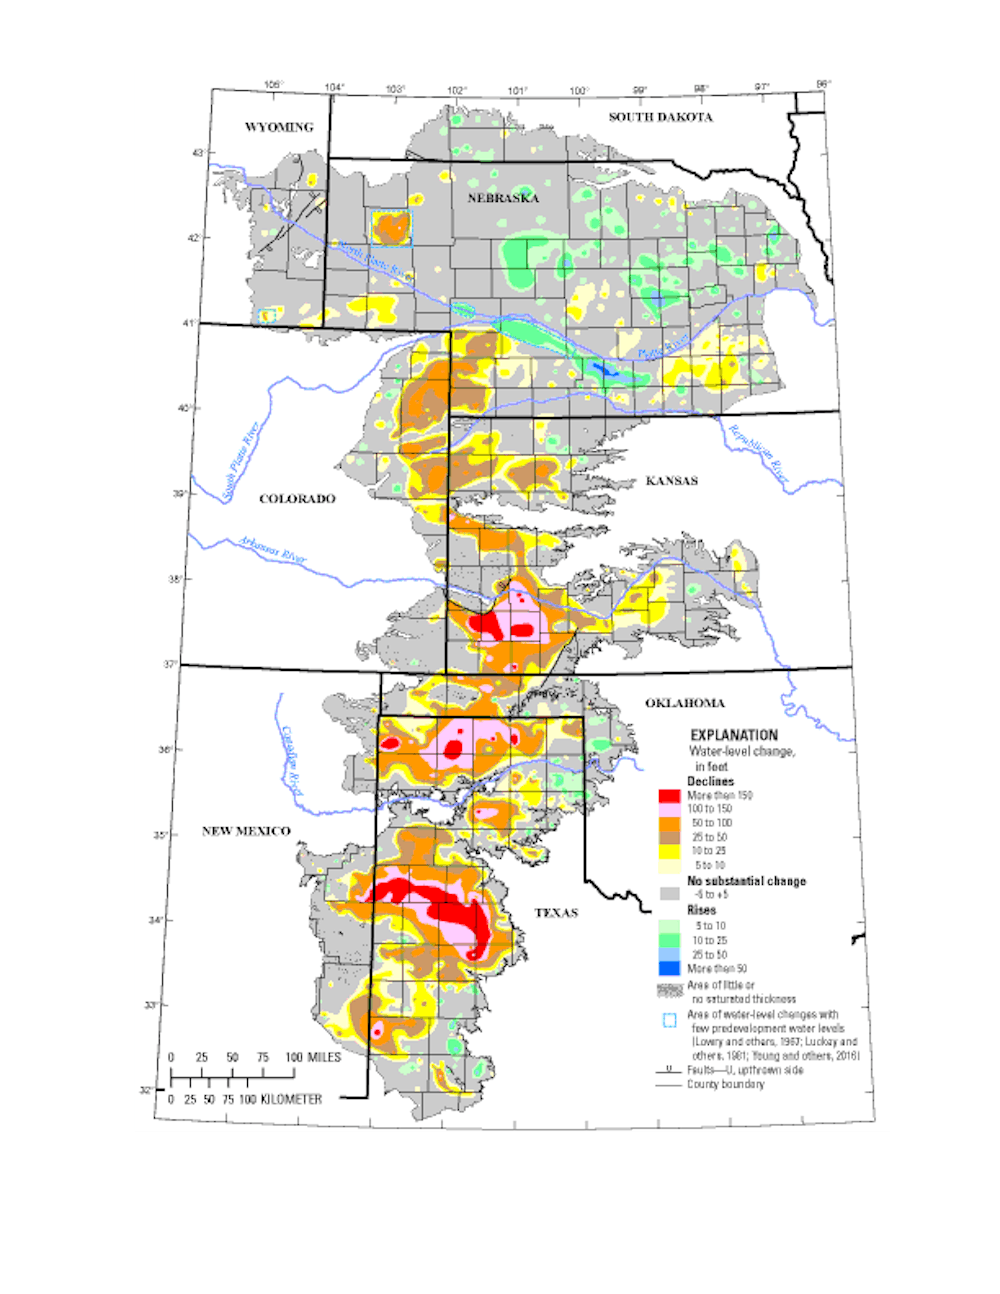
They know that if they do not conserve, the Ogallala Aquifer, the source of their prosperity, will go dry. The Ogallala, also known as the High Plains Aquifer, is one of the largest underground freshwater sources in the world. It underlies an estimated 174,000 square miles of the Central Plains and holds as much water as Lake Huron. It irrigates portions of eight states, from Wyoming, South Dakota and Nebraska in the north to Colorado, Kansas, Oklahoma, New Mexico and Texas in the south.
But the current drought plaguing the region is unusually strong and persistent, driving farmers to rely more on the aquifer and sharpening the debate over its future. A current assessment by the U.S. Drought Monitor, published by the University of Nebraska-Lincoln, the United States Department of Agriculture and the National Oceanic and Atmospheric Administration, shows large swaths of the southern plains experiencing drought ranging from “severe” to “exceptional.”
These worrisome prospects form the dramatic backdrop to “Ogallala: Water for a Dry Land,” now out in its third edition. In it, my fellow historians John Opie and Kenna Lang Archer and I set current debates over the Ogallala Aquifer in the context of the region’s equally conflicted past.
Draining the source
In the 1880s, farmers in the region asserted that there was a steady movement of water beneath their feet, which they called “underflow,” from the Rockies east. Geologist F.N. Darton of the U.S. Geological Survey located the first outlines of the aquifer near Ogallala, Nebraska. His discovery nourished the ambitions of farmers and irrigation promoters. One booster, William E. Smythe, visited Garden City, Kansas, and cheered the irrigated future. Pumping underground water, he told his audience, would build “little homes of pleasing architecture. We will surround them with pretty lawns and fringe them with trees and hedges … in a new Kansas dedicated to industrial independence.”
Ogallala Aquifer water-level changes from predevelopment (about 1950) to 2015.
That bucolic vision took decades to realize. Windmills could only pump so much water, which constrained the amount of land farmers could put into production. And the Ogallala’s sand and gravel composition slowed the downward flow of surface waters to refill it, even in wet seasons.
This did not matter until farmers started adopting better drilling technology, gas-powered water pumps and high-tech irrigation systems after World War II. These advances turned the Central Plains into the world’s breadbasket and meat market, annually generating US$20 billion worth of foodstuffs.
As more pumps were drilled into the aquifer to capture its flow, some started to come up dry, which led to more drilling and pumping. Between the late 19th century and 2005, the U.S. Geological Survey estimates irrigation depleted the aquifer by 253 million acre-feet – about 9 percent of its total volume. And the pace is accelerating. Analyzing federal data, The Denver Post found that the aquifer shrank twice as fast from 2011 through 2017 as it had over the previous 60 years.
This is not the first time that humans have pushed ecosystems on the Central Plains to the breaking point. Starting in the late 19th century, settler-colonists plowed up native grasses that protected the soil. When a series of intense droughts struck in the 1930s, dried-out topsoil was primed to erode in the infamous Dust Bowl. Howling windstorms widely known as “black blizzards” blotted out the sun, blowing away exposed soil and displacing much of the human population.
Farmers who hung on through World War II placed their hope in highly engineered solutions, such as high-powered pumps and center-pivot irrigation systems. These innovations, along with ongoing experiments to determine the most profitable kind of crops to grow and animals to raise, profoundly altered global food systems and the lives and livelihoods of Plains farmers.
Today some advocates support a similar fix for farmers’ water needs: The so-called Great Canal of Kansas, which would pump vast quantities of water from the Missouri River in the east over 360 miles west to the most arid Kansas counties. However, this project could cost up to $20 billion to build and require annual energy outlays of $500 million. It is unlikely to be constructed, and would be a Band-aid solution if it were.
Crop circles in Finney County, Kansas, denote irrigated plots using water from the Ogallala Aquifer.
In my view, Plains farmers cannot afford to continue pushing land and water resources beyond their limits – especially in light of climate change’s cumulative impact on the Central Plains. For example, a recent study posits that as droughts bake the land, lack of moisture in the soil actually spikes temperatures. And as the air heats up, it further desiccates the soil.
This vicious cycle will accelerate the rate of depletion. And once the Ogallala is emptied, it could take 6,000 years to recharge naturally. In the words of Brent Rogers, a director of Kansas Groundwater Management District 4, there are “too many straws in too small of a cup.”
Some far-sighted farmers are responding to these interlocking challenges. Even as they pursue efficiencies in irrigation, many are shifting from water-intense crops like cotton to wheat. Still others, notably in west Texas, are converting back to non-irrigated dryland agriculture – a recognition of the stark limitations of irrigation dependency. Farmers who are depleting other aquifers in Latin America, eastern Europe, the Middle East and Asia could face similar choices.
Whether these initiatives will become widespread, or can sustain agriculture on the Central Plains, is an open question. But should instead farmers and ranchers drain the Ogallala Aquifer in pursuit of quick profits, the region may never recover.
The planet urgently needs to transition to a green economy because fossil fuel pollution risks pushing the Earth into a lasting and dangerous "hothouse" state, researchers warned on Monday.
If polar ice continues to melt, forests are slashed and greenhouse gases rise to new highs -- as they currently do each year -- the Earth will pass a tipping point.
Crossing that threshold "guarantees a climate 4-5 Celsius (7-9 Fahrenheit) higher than pre-industrial times, and sea levels that are 10 to 60 meters (30-200 feet) higher than today," cautioned scientists in the Proceedings of the National Academy of Sciences.
And that "could be only decades ahead," they said.
- What is 'Hothouse Earth'? -
"Hothouse Earth is likely to be uncontrollable and dangerous to many," said the article by scientists at University of Copenhagen, Australian National University and the Potsdam Institute for Climate Impact Research in Germany.
Rivers would flood, storms would wreak havoc on coastal communities, and coral reefs would be eliminated -- all by century's end or even earlier.
Global average temperatures would exceed those of any interglacial period -- meaning warmer eras that come in between Ice Ages -- of the past 1.2 million years.
Melting polar ice caps would lead to dramatically higher sea levels, flooding coastal land that is home to hundreds of millions of people.
"Places on Earth will become uninhabitable if 'Hothouse Earth' becomes the reality," said co-author Johan Rockstrom, executive director of the Stockholm Resilience Centre.
- Where is the tipping point? -
Researchers suggest the tipping point could come once the Earth warms to 3.6 Fahrenheit (2 Celsius) over pre-industrial times.
The planet has already warmed 1 C over pre-industrial times, and is heating up at a rate of 0.17 C per decade.
"A 2 C warming could activate important tipping elements, raising the temperature further to activate other tipping elements in a domino-like cascade that could take the Earth System to even higher temperatures," said the report.
This cascade "may tip the entire Earth system into a new mode of operation," said co-author Hans Joachim Schellnhuber, director of the Potsdam Institute for Climate Impact Research.
Experts also worry about phenomena like wildfires, which will spread as the planet gets hotter and drier and have the potential to accelerate carbon dioxide buildup and global warming.
- How they calculated this -
The "Perspective" article is based on previously published studies on tipping points for the Earth.
The scientists also examined conditions the Earth has seen in the distant past, such as the Pliocene period five million years ago, when CO2 was at 400 ppm like today.
During the Cretaceous period, the era of the dinosaurs some 100 million years ago, CO2 levels were even higher at 1,000 ppm, largely due to volcanic activity.
AFP / Simon MALFATTOClimate 'tipping points': the earth's ticking timb bombs
To state that 2 C is a no-return threshold "is new," said Martin Siegert, co-director of the Grantham Institute at Imperial College London, who was not involved in the study.
The study authors "collated previously published ideas and theories to present a narrative on how the threshold change would work," he said.
"It's rather selective, but not outlandish."
- How to stop it -
People must immediately change their lifestyle to be better stewards of the Earth, the researchers said.
Fossil fuels must be replaced with low or zero emissions energy sources, and there should be more strategies for absorbing carbon emissions such as ending deforestation and planting trees to absorb carbon dioxide.
Soil management, better farming practices, land and coastal conservation and carbon capture technologies are also on the list of actions.
Yet even if humans stopped emitting greenhouse gases, the current warming trend could trigger other Earth system processes, called feedbacks, driving even more warming.
These include permafrost thaw, deforestation, loss of northern hemisphere snow cover, sea ice and polar ice sheets.
Researchers say it's not certain that the Earth can remain stable.
"What we do not know yet is whether the climate system can be safely 'parked' near 2 C above preindustrial levels, as the Paris Agreement envisages," said Schellnhuber.






 In other words, scientific pursuits need to be coupled with a humanist tradition — to highlight not just how psychedelics work, but why that matters.
 Sarasota Dolphin Research Program/AFP / HO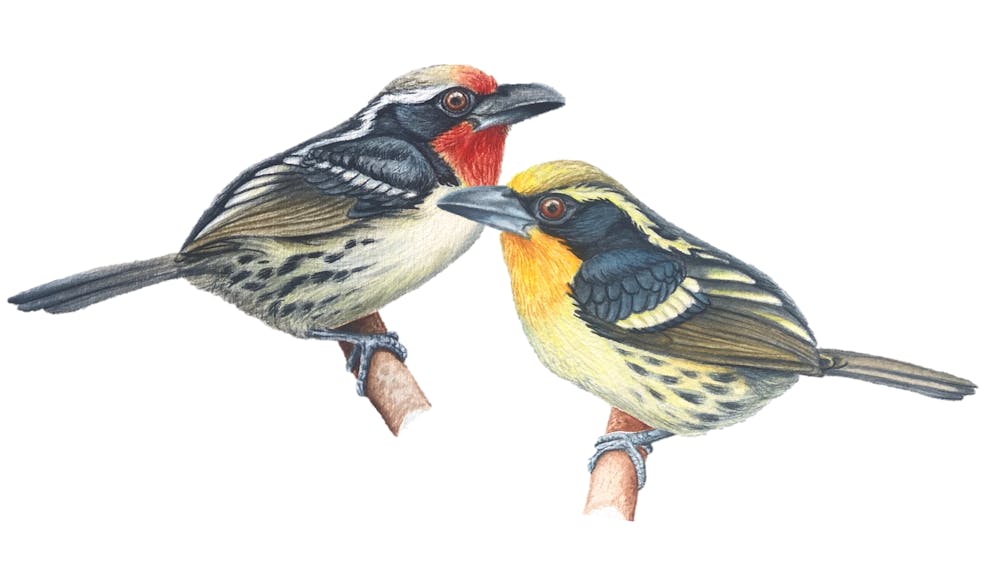



 In particular, by focusing on
  AFP / Gal ROMA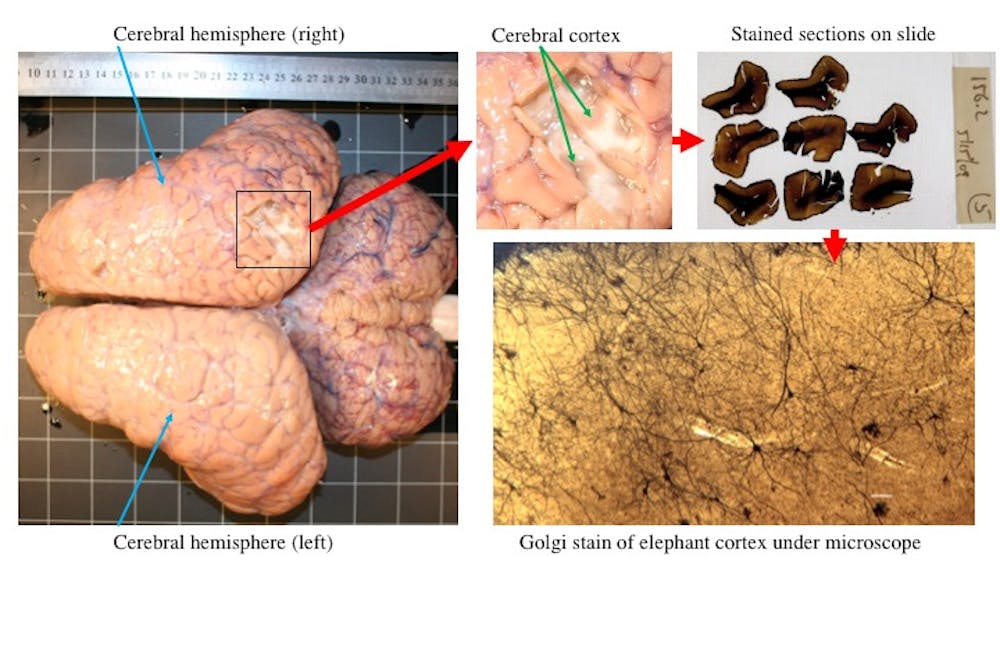
 The brains of all species are unique. Indeed, even the brains of individuals within a given species are unique. However, the special morphology of elephant cortical neurons reminds us that there is certainly more than one way to wire an intelligent brain.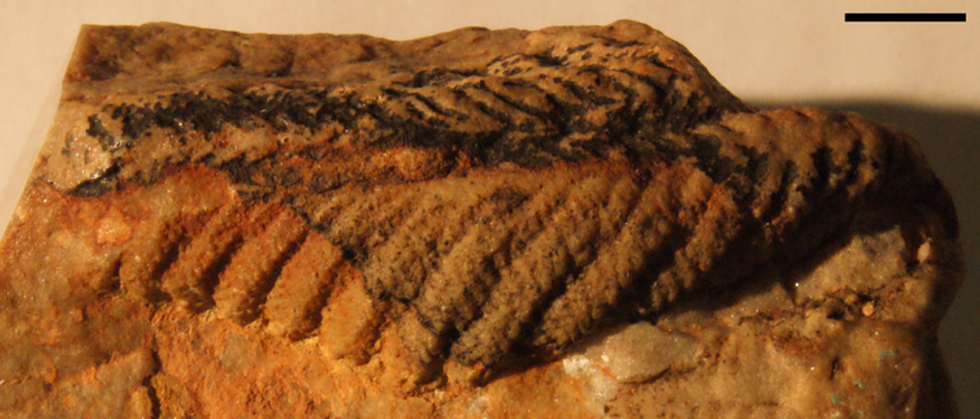


 This could mean that the petalonamids adapted more successfully to the changes of the Cambrian period than had been thought, or that the Ediacaran period and its animals were less alien and more advanced than previously realised. We can be confident, however, that the animal kingdom we occupy is much older than we once thought.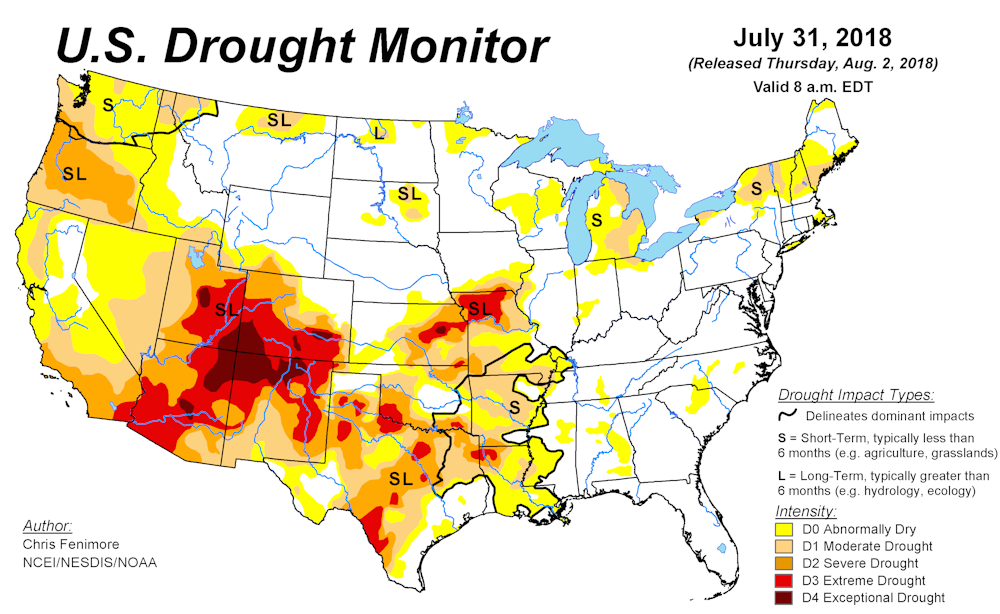

 Whether these initiatives will become widespread, or can sustain agriculture on the Central Plains, is an open question. But should instead farmers and ranchers drain the Ogallala Aquifer in pursuit of quick profits, the region may never recover.
 AFP / Simon MALFATTO